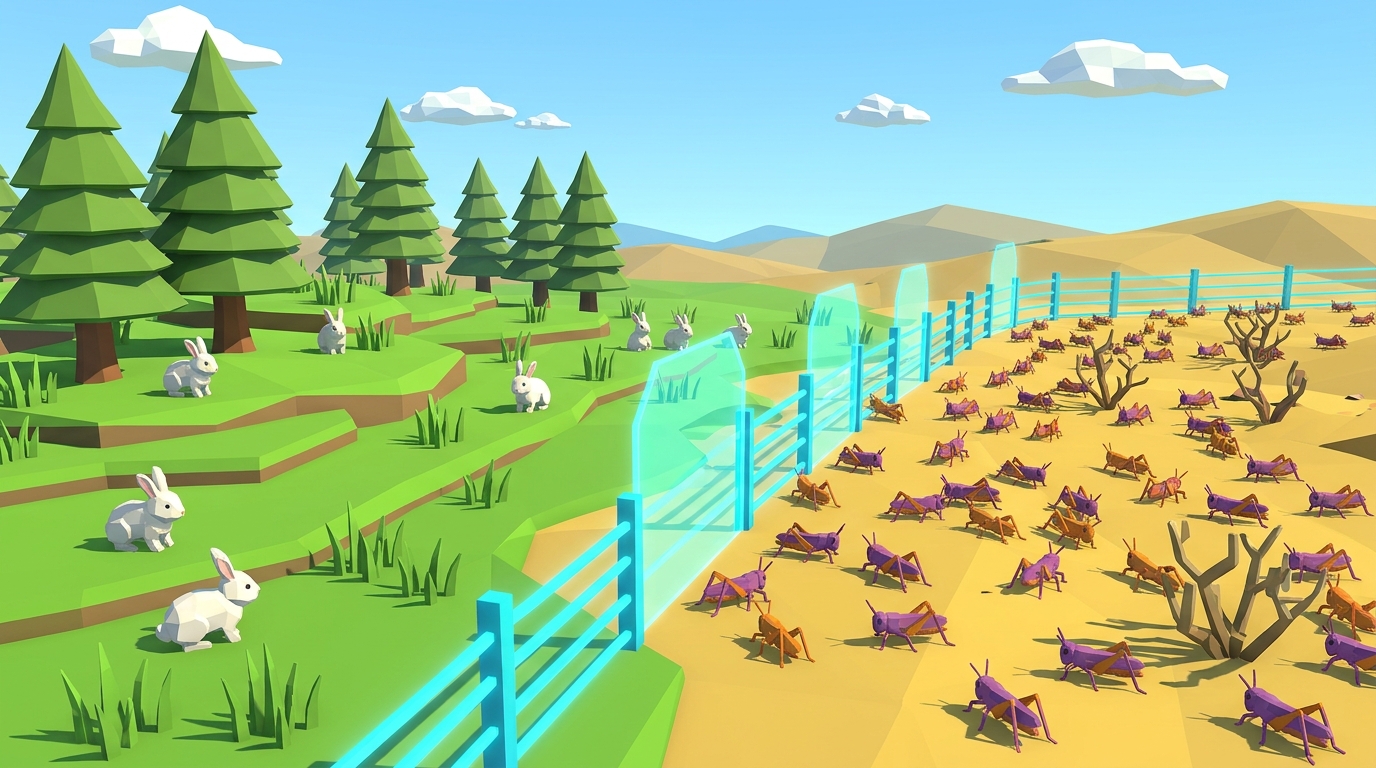

Density-Dependent vs. Density-Independent: Why Overcrowding Breeds Contagion
In natural ecosystems, wild animal populations never grow unchecked forever. Environmental boundaries always arise to regulate their numbers. In middle school biology, ecologists classify these natural checks into two distinct categories: density-independent factors and density-dependent factors.
A density-independent factor impacts a population with equal severity regardless of how many animals live in the habitat. A sudden deep winter freeze, a wildfire sparked by lightning, or a river flash flood does not care if there are five rabbits in the valley or five hundred; each individual animal faces the exact same environmental odds of freezing or escaping.
In contrast, a density-dependent factor grows exponentially more lethal as animals pack closer together. Competition for limited food, fights over nesting territory, and airborne or waterborne diseases are textbook density-dependent factors. When animals live far apart, an individual carrying a virus might cough or touch vegetation, but the pathogen dies before encountering another host.
When herds become crowded around shrinking watering holes or overgrazed meadows, physical contact rates explode. What was a minor background sickness turns into a rolling epidemiological wildfire.
In Level 14 of the Praxos 3D simulation ("Sickness Spreads"), students investigate this exact inflection point: discovering why spatial spacing and genetic diversity are nature's ultimate immune defense.
Load Level 14 in the 3D lab. Keep all 35 rabbits clustered in the center 4x4 paddock and observe how fast infection spreads. Then reset the run, activate the Dispersal Whistle to spread them into four peripheral pastures across the river, and measure how many individuals stay healthy.
Launch Level 14 LabThe Mathematics of Contagion: Susceptible, Infected, and Recovered (SIR)
To understand how wildlife biologists prevent epidemics in national parks and game reserves, students explore the classic SIR epidemiological model developed by Kermack and McKendrick in 1927. In systems thinking (Ormancı 2026), the entire population is tracked across three distinct stocks connected by directional flows:
1. Susceptible Stock (S): Healthy organisms that have never encountered the pathogen and possess no active antibodies. They are vulnerable to infection.
2. Infected Stock (I): Contagious organisms actively carrying the virus or bacterium. Each day they move through the habitat, they shed pathogens and risk transmitting the disease to susceptible neighbors.
3. Recovered / Removed Stock (R): Organisms that survived the sickness, developed lifelong immunity, and can no longer transmit the infection; or individuals that succumbed to the disease and were removed from the living population.
The critical tipping point in any epidemic is governed by the Basic Reproduction Number, written as $R_0$ (pronounced "R-naught"). In mathematical terms, $R_0 = \frac{\beta \cdot N}{\gamma}$, where $\beta$ represents the transmission contact probability, $N$ represents population density, and $\gamma$ represents the recovery rate.
If $R_0 > 1.0$, each infected animal transmits the pathogen to more than one susceptible peer on average. The disease spreads exponentially across the landscape. If conservationists can lower contact density ($N$) or reduce transmission probability ($\beta$) so that $R_0 < 1.0$, the epidemic burns out naturally and the herd survives.
A real-world example is Chronic Wasting Disease (CWD) in North American white-tailed deer and elk. When hunting regulations are removed or artificial feeding stations concentrate hundreds of deer around a single corn trough, saliva and prions spread with alarming speed. Wildlife managers use herd thinning and the removal of artificial feeding sites to drop density back below the epidemic threshold.
| Limiting Factor | Classification Type | Mechanism of Action | Systems Dynamic |
|---|---|---|---|
| EPIDEMICInfectious Disease & Parasites | Density-Dependent | Pathogen transmission depends on frequent physical encounters between hosts | Strong reinforcing feedback that accelerates with herd crowding |
| CLIMATESevere Winter Blizzard | Density-Independent | Sub-zero cold snaps freeze vegetation and stress animal metabolism equally | Exogenous shock independent of population count |
| COMPETITIONForage & Grass Competition | Density-Dependent | Per-capita food consumption exceeds biomass replenishment rate K | Balancing feedback loop that triggers carrying capacity crashes |
| DISTURBANCEWildfire Burn Event | Density-Independent | Consumes acreage based on fuel load and wind speed rather than animal density | Abiotic disturbance clearing land for secondary succession |
Inside Simulation Level 14: Dispersal Buffers and Quarantine Levers
In Level 14, students step into the role of a Wildlife Health Officer overseeing a fenced nature sanctuary. The level starts with 35 healthy rabbits densely concentrated in a central 4x4 meadow enclosure flanked by a crystal blue river.
At Day 8, an infection alert triggers: Patient Zero develops a glowing amber halo. Within 48 hours, every time this infected rabbit hops adjacent to a green-halo susceptible neighbor, an 80% transmission roll occurs. Without student intervention, the central valley becomes a sea of amber halos, causing 85% herd mortality by Day 25.
Students have three strategic levers to intervene before the epidemic wave crests:
First, the Herd Dispersal Whistle. Using sound pulses, students encourage crowded animals to disperse outwards across the river into four separate pastures. Spreading 35 animals across a 12x12 grid instead of a 4x4 pen drops local contact frequency by over 70%, immediately depressing $R_0$.
Second, River Bridge Quarantine Gates. By closing the wooden drawbridges spanning the river, students can trap Patient Zero and early infected cases on an isolated island pasture, creating a physical firebreak that prevents the virus from reaching the healthy peripheral herds.
Third, Genetic Diversity Breeding Reserves. By allocating conservation points to genetic heterozygosity, students increase natural immune response efficiency, boosting the recovery rate ($\gamma$) and reducing mortality.
Identify Patient Zero on Day 8
Monitor the central meadow for the initial amber aura indicator and track the animal's movement trajectory across the herd.
Activate the Dispersal Whistle to Break Clustering
Scatter healthy rabbits into outer quadrants to reduce physical encounters below the epidemic transmission threshold.
Lower Bridge Gates for Physical Quarantine
Seal the bridge access points to keep infected animals isolated on the south pasture until recovery or natural clearance occurs.
Sustain Herd Population Above 18 Through Day 60
Maintain clean foraging zones in uncontaminated pastures and verify that the epidemic curve flattens to zero active infections.
Common Student Misconceptions About Wildlife Epidemics
When middle school students explore disease dynamics in simulations, several intuitive misunderstandings routinely surface:
Misconception 1: "Stronger animals are completely immune to disease." Students often believe that animals with high health bars never get sick. In reality, while nutrition supports immune vigor, an overwhelming viral load delivered through continuous high-density contact will sicken even prime adults.
Misconception 2: "Predators make wildlife sickness worse." Many learners assume that adding wolves or coyotes to a sick deer herd will accelerate extinction. In nature, the opposite is true: predators selectively target slow, visibly ill, or coughing prey, acting as biological sanitation filters that remove contagion vectors before they can infect the wider herd.
Misconception 3: "You must cure every single sick animal to stop an epidemic." Students frequently attempt to treat individual animals one by one. In systems epidemiology, you do not need to eliminate every microbe; you simply need to drop contact rates below the mathematical threshold ($R_0 < 1.0$). Once $R_0$ drops below one, the chain reaction breaks and the disease expires on its own.
Pathogens do not travel on wings of magic; they travel along physical contact networks. If you scatter the host population and build quarantine buffers, you starve the transmission fire of fuel.
Frequently Asked Questions About Level 14
Practical reference answers for educators, parents, and curious science students:
What NGSS standards does Level 14 satisfy?
How does social distancing in wildlife mirror human epidemiology?
What printable lab activity accompanies Level 14?
Level 14 Mission Log & Wildlife Epidemic Curve Tracker (PDF)
A printable 24-page Expedition Science Journal activity calculating transmission contact rates, graphing the classic SIR bell curve of infections, and designing wildlife quarantine dispersal zones.