The Thread vs. The Hammock: Why Linear Food Chains Are an Ecological Myth
Pick up almost any elementary science textbook and you will see a clean, tidy diagram: Sun -> Grass -> Grasshopper -> Robin -> Hawk. Arrows point neatly from left to right, creating the comforting impression that nature functions like an orderly assembly line.
Yet if real ecosystems actually operated like straight-line food chains, life on Earth would have gone extinct millions of years ago. A linear chain has a fatal mathematical vulnerability: every single organism represents a Single Point of Failure (SPOF).
If a seasonal drought eliminates grasshoppers, the robins that depend solely on them have zero food and starve. With all robins dead, the hawks starve in turn. A shock at any step of the sequence triggers what engineers call a catastrophic cascade failure.
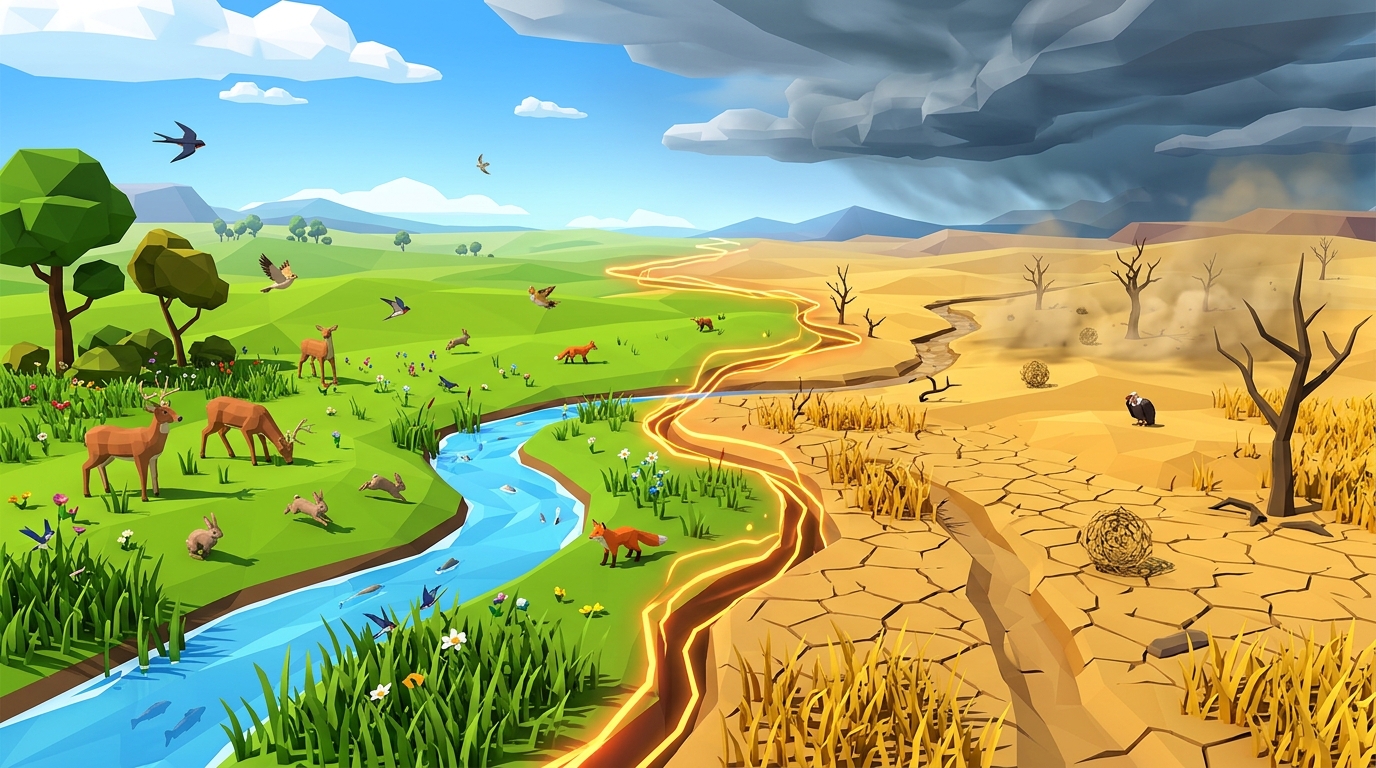
In contrast, healthy natural biomes organize into tangled, multi-tiered networks known as food webs. A food web is not a single thread; it is a woven hammock. If one strand snaps, the remaining threads stretch, absorb the extra load, and hold the entire structure aloft.
In Level 16 of the Praxos 3D simulation ("The Food Web"), students conduct controlled comparative experiments to discover how network topology and redundant energy routes preserve life during ecological crises.
Launch the comparative arena in Level 16. Run both Enclosure A (Linear Chain) and Enclosure B (Redundant Web) for 20 undisturbed days to verify equal baseline health. Then trigger the Grasshopper Blight tool and measure how many days it takes for apex predators in each enclosure to face extinction.
Launch Level 16 LabThe Engineering of Ecological Resilience: Directed Graphs and Backup Pathways
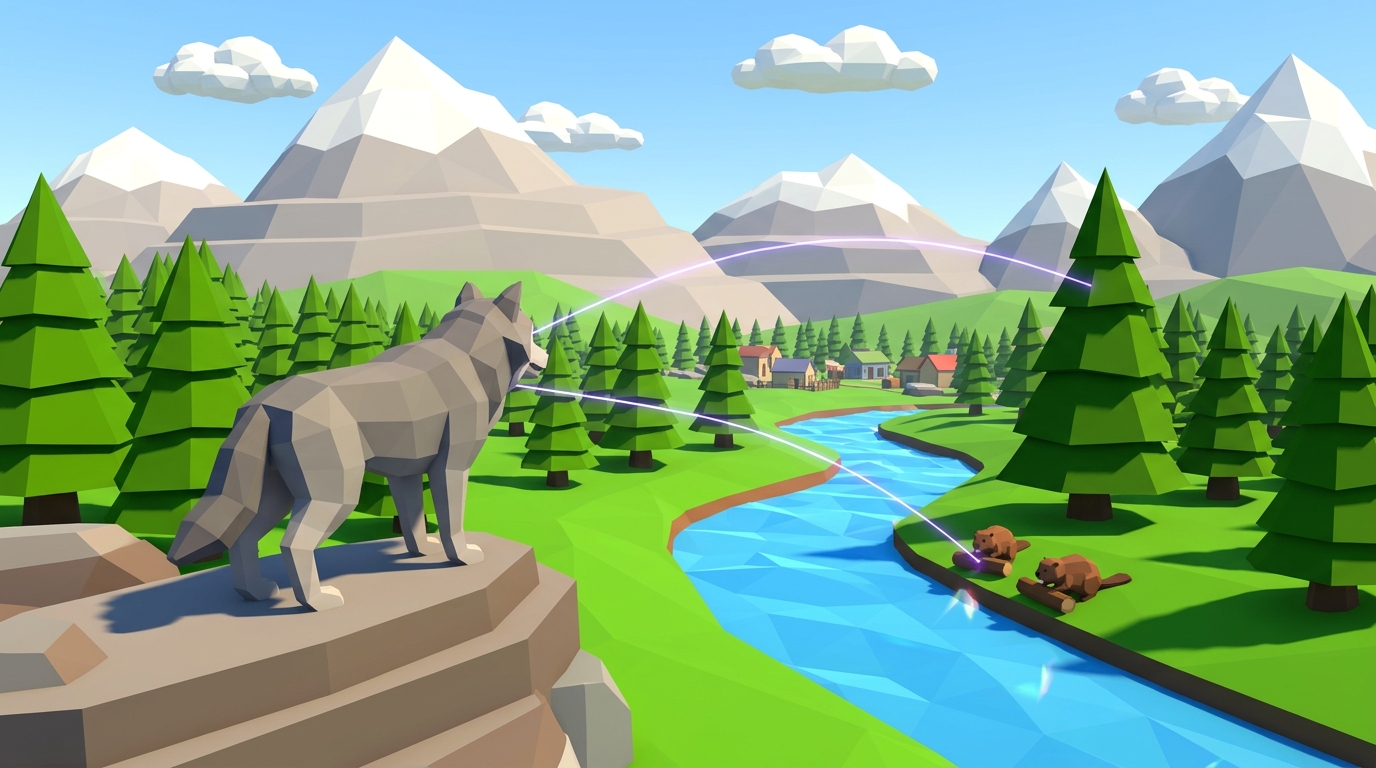
To understand why food webs endure, students analyze nature through the lens of graph theory and systems architecture (Ormancı 2026). An ecosystem can be modeled as a directed mathematical network where living species are "nodes" and feeding relationships are "edges" (or links).
In Enclosure A's linear chain of 4 species, there are only 3 directional links. The network connectivity density is at its absolute minimum. If any intermediate node is severed, graph connectivity collapses to zero for all downstream consumers.
In Enclosure B's redundant web of 8 species, there are 14 interconnected links. Hawks do not feed exclusively on robins; they hunt mice, voles, and rabbits. Robins do not feed exclusively on grasshoppers; they forage for wild blackberries, beetle grubs, and clover seeds.
When an exogenous disturbance wipes out grasshoppers, robins instantly pivot their feeding outflow toward berries and beetles. Because hawks continue to hunt mice and rabbits, their trophic inflow remains stable. The system absorbs the shock without losing its apex tier.
A powerful historical phenomenon illustrating this principle is the vulnerability of single-crop agricultural monocultures versus diverse natural biomes. During the Irish Potato Famine of 1845, millions of people depended almost entirely on a single potato variety (the Lumper). When the fungal blight Phytophthora infestans struck, the linear agricultural chain collapsed with zero backup pathways. In contrast, in native Andean cloud forests where wild ancestors of the potato coexist alongside dozens of alternative tubers, identical blights cause negligible disruption.
| Structural Characteristic | Linear Food Chain (Low Redundancy) | Ecological Food Web (High Redundancy) | Systems & Engineering Analog |
|---|---|---|---|
| RELIABILITYNode Failure Impact | Loss of any intermediate species collapses all higher trophic levels | Loss of an intermediate species causes dynamic rerouting with minimal apex loss | Single Point of Failure (SPOF) vs. High Availability Failover |
| FLEXIBILITYDietary Specialization | Extreme obligate feeding on a single target organism | Flexible generalist foraging across multiple trophic tiers | Hardcoded single dependency vs. Polymorphic routing |
| STABILITYBiomass Stability | Volatile boom-and-bust cycles with violent population swings | Dampened oscillations buffered by prey switching and distributed predation | Unbuffered resonant oscillator vs. Damped control loop |
| RESILIENCERecovery Velocity | Extremely slow; extinct tiers must be completely reintroduced | Rapid; surviving generalists maintain energetic flows while prey recovers | Manual cold restart vs. Autonomous self-healing infrastructure |
Inside Simulation Level 16: Comparative Stress-Testing Under Blight Shocks
In Level 16, the simulation screen splits into two synchronized test paddocks running side by side under identical weather, temperature, and sunlight parameters.
Paddock A (The Linear Chain) features 40 units of green grass, 20 grasshoppers, 8 songbirds, and 2 hawks. The ecosystem runs smoothly through Day 20, maintaining steady populations as each tier eats the one below it.
Paddock B (The Web of Resilience) features 40 units of mixed vegetation (grass, berry bushes, and clover), 12 grasshoppers, 8 field mice, 6 rabbits, 6 songbirds, 2 red foxes, and 2 hawks. Total biomass matches Paddock A, but the network density is more than four times higher.
At Day 20, students deploy the "Pathogen Shock" event: an insect virus that instantly wipes out all grasshoppers in both paddocks.
In Paddock A, the failure is swift: songbirds run out of prey on Day 21 and starve to zero by Day 26. Deprived of songbirds, both hawks perish by Day 34, leaving Paddock A an empty field overgrown with unmanaged grass.
In Paddock B, the shock triggers dynamic energy rerouting: songbirds shift 80% of their daily intake to berries, while hawks increase their rabbit and mouse predation. Total biomass in Paddock B dips by merely 7% before stabilizing. By Day 80, Paddock B completes the mission with all trophic tiers intact.
Verify Baseline Equilibrium in Both Paddocks
Run Days 0 to 20 without intervention and confirm that both enclosures sustain stable populations and healthy trophic balances.
Trigger the Day 20 Insect Pathogen Shock
Deploy the targeted blight lever to eliminate grasshoppers simultaneously across both comparative habitats.
Record Cascade Starvation in Paddock A
Log the exact sim day when songbirds and hawks vanish from the linear enclosure, observing zero failover capability.
Monitor Autonomous Flow Rerouting in Paddock B
Use the Energy Flow Inspector tool to verify that songbirds consume berries and hawks prey on rodents, sustaining the web through Day 80.
Common Student Misconceptions About Food Chains and Webs
When learning trophic dynamics, middle schoolers commonly encounter three persistent misconceptions:
Misconception 1: "Food chains and food webs are just two words for the exact same thing." A food chain is a single hypothetical path; a food web is the actual multi-path network that exists in nature. Believing nature is made of chains causes students to overlook the vital role of generalist species and backup food sources.
Misconception 2: "Carnivores only eat what they love most." Students often assume a hawk will starve rather than hunt a different prey. In reality, predators practice optimal foraging: if their preferred prey becomes scarce, they switch to the next most energetic alternative, buffering the entire system.
Misconception 3: "Complexity always makes systems harder to keep alive." In human machinery, having more moving parts can increase breakdown risk. In ecological networks, however, having multiple overlapping connections creates insurance: if one link fails, alternative pathways keep life flowing.
Do not put all your ecological eggs in one basket. When an organism has multiple ways to gather energy, a disturbance that destroys one option is just a temporary inconvenience, not an extinction event.
Frequently Asked Questions About Level 16
Reference answers for science teachers, homeschooling parents, and young systems researchers:
What NGSS standards does Level 16 align with?
How do scientists measure food web complexity?
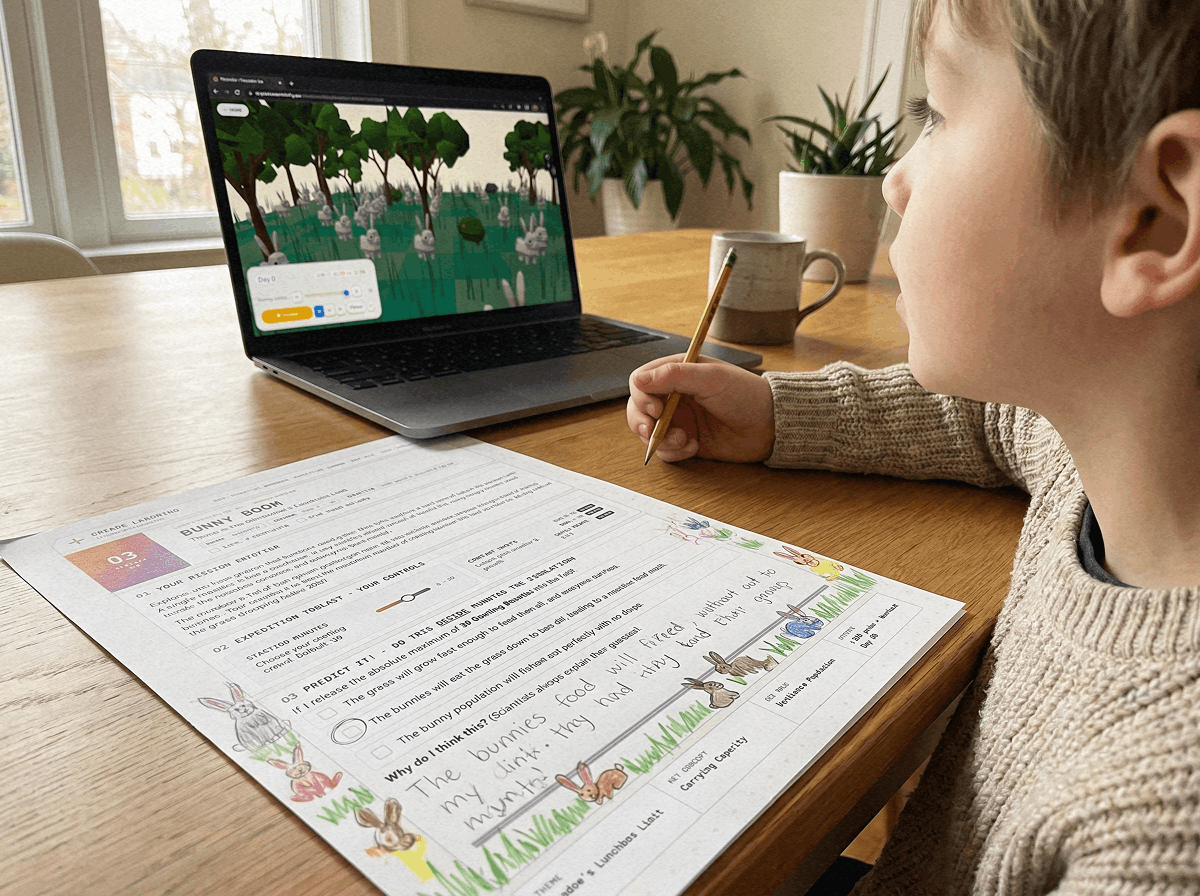
What printable challenge is included in the Expedition Science Journal?
Level 16 Mission Log & Network Connectivity Density Calculator (PDF)
A printable 24-page Expedition Science Journal activity mapping trophic nodes and links, calculating directed graph density, and predicting failure cascades under simulated species extinctions.