Beyond Flat Cartography: Why Dynamic 3D Mapping Changes How We See Earth
For generations, middle school science classrooms introduced continental drift using flat paper maps. Students traced jagged coastlines across two dimensions, squinted at static black-and-white arrows, and tried to imagine how massive slabs of solid rock could slide across a curved planet. Yet flat projections inherently distort spatial scale, conceal subterranean depth, and fail to illustrate the continuous convective engine operating beneath the surface.
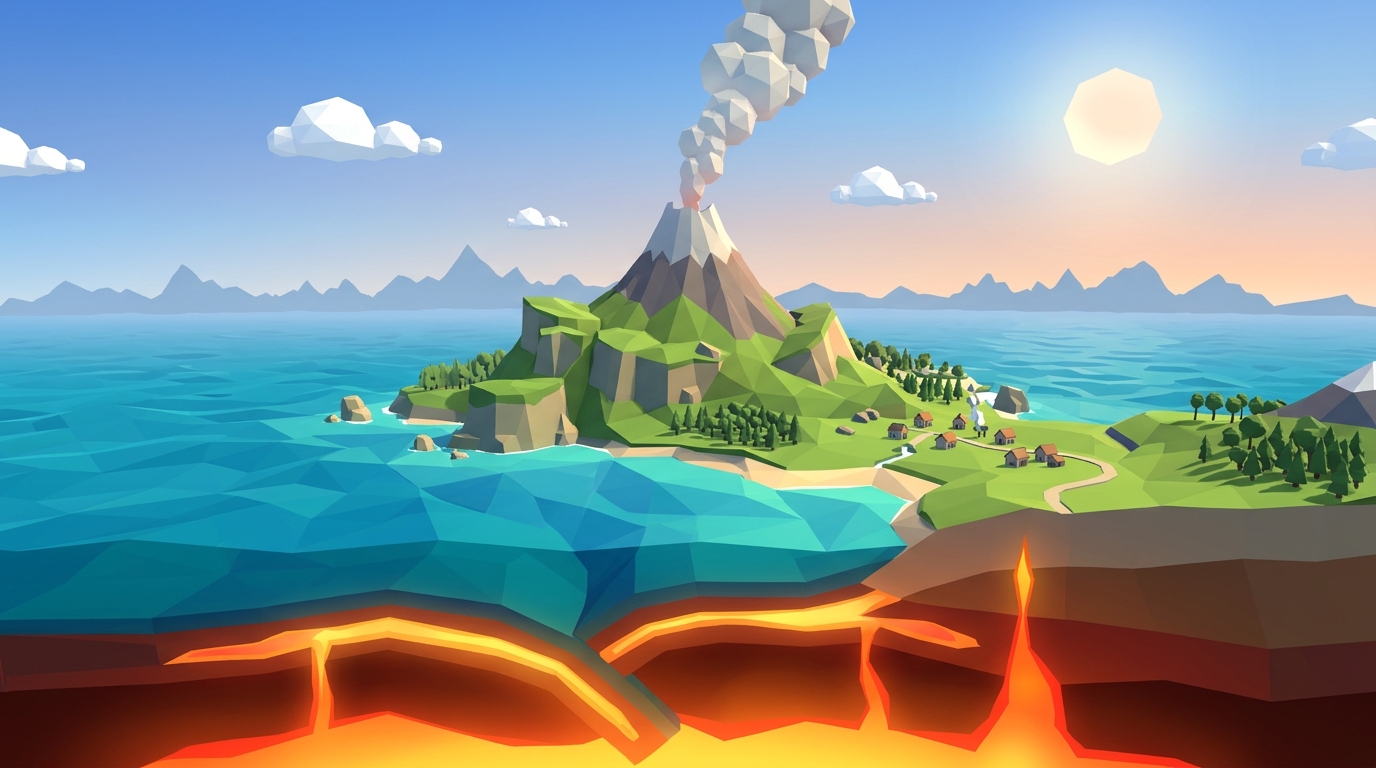
Using a plate tectonics interactive map changes this dynamic completely. When students rotate a three-dimensional globe, manipulate boundary vectors, and peel back the crust to reveal the asthenosphere, geological theory transforms into an active spatial reality. Rather than memorizing isolated vocabulary lists, learners observe how convergent trenches, spreading ridges, and strike-slip faults connect across a single continuous planetary system.
I built our interactive geophysics simulations at Praxos Learning specifically to bridge this conceptual gap. In this guide, I examine how a modern interactive plate boundary map functions, break down the seven primary lithospheric plates, and provide an inquiry-based lesson framework for homeschool educators and classroom teachers.
How to Read a Plate Tectonics Interactive Map: The 7 Major Plates
Earth outer shell is not a monolithic sphere of unbroken stone; it consists of approximately fifteen rigid lithospheric slabs floating atop the ductile, high-temperature asthenosphere. While smaller microplates such as the Juan de Fuca and Cocos plates produce intense local seismicity, seven colossal plates account for roughly ninety-four percent of Earth surface area.
When exploring a lithospheric plates map, the first distinction students must recognize is the difference between continental crust and oceanic crust. Continental crust consists predominantly of low-density, buoyant granitic rock averaging thirty to fifty kilometers in thickness. In contrast, oceanic crust is thin, dense, and basaltic, typically measuring five to ten kilometers deep. Because oceanic lithosphere is significantly denser, it inevitably subducts beneath lighter continental plates whenever the two collide.
The following reference table outlines the seven major lithospheric plates, their crustal composition, primary boundary interactions, and the dominant geological landforms visible on our tectonic plates map 3d view:
| Plate Name | Approx. Area (Million km²) | Crustal Composition | Dominant Boundary Types | Signature Geological Features |
|---|---|---|---|---|
| Largest PlatePacific Plate | 103.3 | Predominantly Oceanic | Convergent & Transform | Ring of Fire, Mariana Trench, Hawaiian Hotspot |
| North American Plate | 75.9 | Continental & Oceanic | Transform, Convergent, Divergent | San Andreas Fault, Cascade Volcanic Arc, Mid-Atlantic Ridge |
| Eurasian Plate | 67.8 | Predominantly Continental | Convergent & Divergent | Himalayan Mountain Range, Tibetan Plateau, Iceland Rift |
| African Plate | 61.3 | Continental & Oceanic | Divergent & Convergent | East African Rift System, Red Sea Spreading Center |
| Antarctic Plate | 60.9 | Continental & Oceanic | Divergent (Surrounded by Ridges) | Transantarctic Mountains, Mount Erebus Volcanic System |
| Indo-Australian Plate | 58.9 | Continental & Oceanic | Convergent Collision & Subduction | Sunda Trench, Southern Alps (NZ), Himalayan Orogeny |
| South American Plate | 43.6 | Continental & Oceanic | Convergent Subduction & Divergent | Andes Mountain Volcanic Chain, Peru-Chile Trench |
Decoding the Three Boundary Types on an Interactive Plate Boundary Map
A static diagram typically displays tectonic boundaries as colored lines on paper. In contrast, an interactive plate boundary map renders the mechanical forces that make boundaries active: pressure, friction, thermal convection, and gravitational sinking. Every geological landform on Earth traces back to three fundamental boundary interactions.
First, convergent boundaries occur where two lithospheric plates advance toward each other. When dense oceanic crust collides with buoyant continental crust, the oceanic slab flexes downward into the mantle, forming an abyssal ocean trench and generating intense frictional earthquakes. As the subducting slab carries seawater deep into the mantle, it triggers flux melting, creating pressurized magma chambers that feed explosive stratovolcanoes like Mount St. Helens. When two buoyant continental masses collide (such as India and Eurasia), neither slab subducts; instead, the crust crumples upward into massive orogenic belts like the Himalayas.
Second, divergent boundaries occur where tectonic plates pull apart. Deep within the upper mantle, convective upwelling depressurizes hot peridotite rock, generating basaltic magma that wells up to create new oceanic crust along mid-ocean ridges. Along the Mid-Atlantic Ridge, plates separate at roughly two to five centimeters per year. When divergence begins beneath a continental landmass, such as the East African Rift, the continent slowly tears apart, forming rift valleys that eventually flood to form young ocean basins.
Third, transform boundaries develop where plates slide laterally past each other without creating or destroying lithosphere. Because tectonic rock faces are jagged and irregular, plates lock together for decades or centuries as shear stress accumulates. When shear strength is finally exceeded, the plates slip violently, releasing massive seismic waves along strike-slip faults like California San Andreas Fault. Our convergent divergent transform boundaries map allows students to zoom into these fault lines in real time.
Earth is not expanding. The volume of new basaltic crust generated at divergent mid-ocean spreading ridges is precisely balanced by the volume of cold oceanic lithosphere consumed at convergent subduction trenches. Our interactive 3D simulations let students verify this conservation law firsthand.
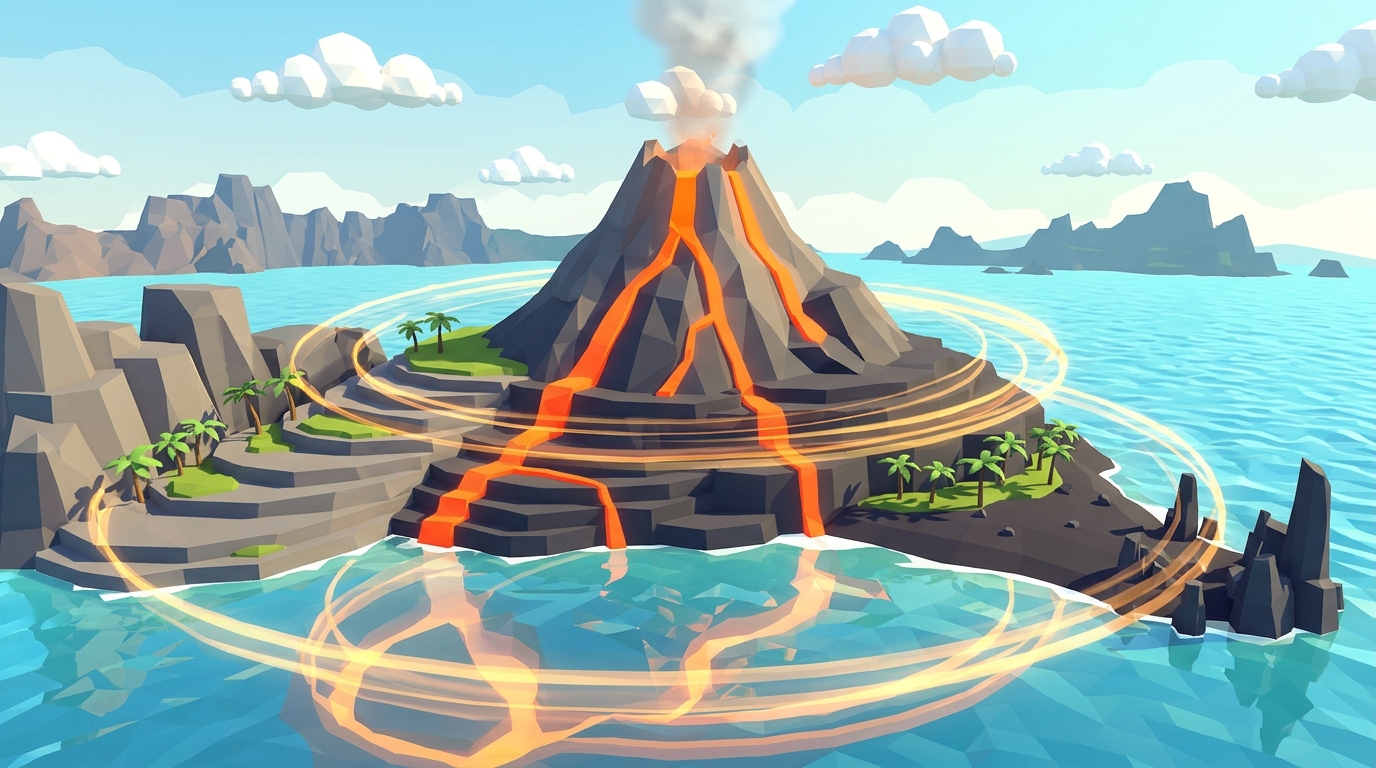
Explore Dynamic Fault Lines in Volcano Island
Shift tectonic boundaries, adjust convective mantle velocities, and observe real-time fault rupture and subduction in our browser-based 3D geophysics lab.
Teaching this topic tomorrow? Download the Free NGSS Student Lab Sheet (Printable PDF)
Printable boundary mapping worksheets, fault identification tables, and cross-section graphing exercises designed to accompany our 3D interactive map.
Hands-On Classroom Routine: 4 Steps for Guided Inquiry
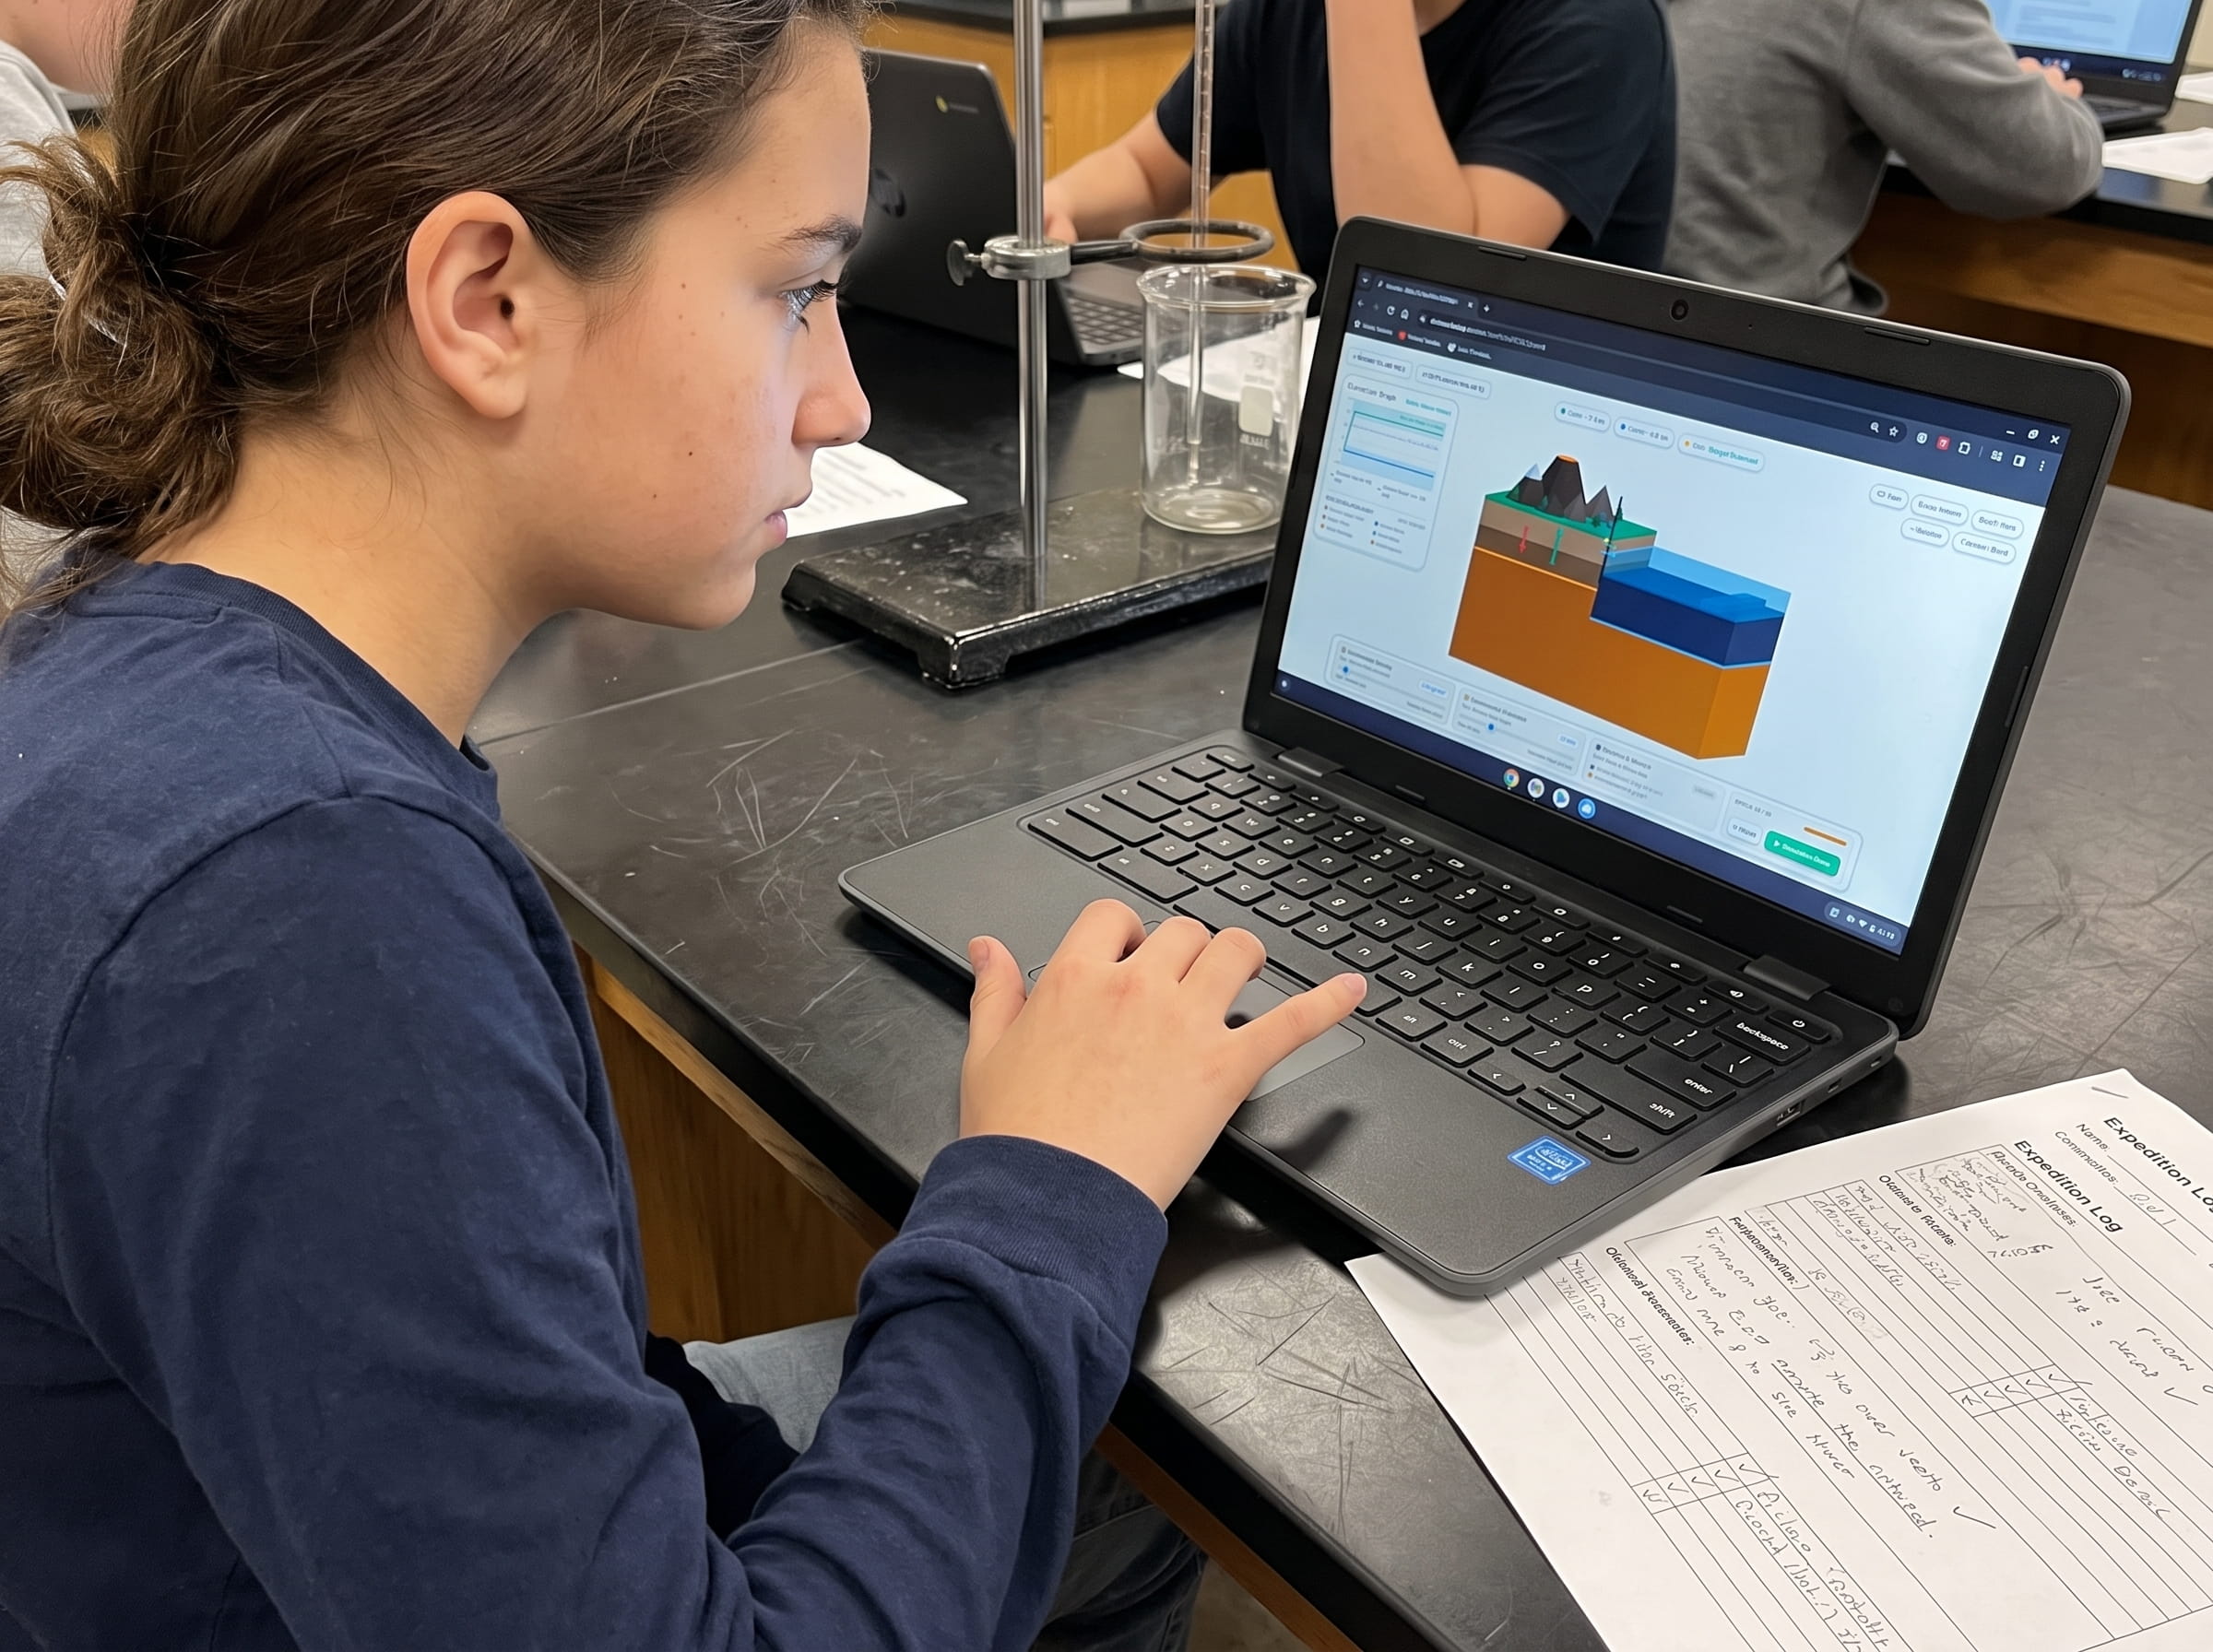
To maximize learning outcomes, digital exploration should always pair with physical modeling and structured scientific reasoning. When students interact with our tectonic plate movement simulator alongside our 24-page Field Geologist Logbook, they move from passive observers to active scientific investigators.
Here is the four-step inquiry routine I recommend for a 45-minute middle school science block or homeschool laboratory session:
Orient the Globe and Identify the 7 Major Plates
Have students open the plate tectonics interactive map on their Chromebooks or tablets. Instruct them to rotate the 3D globe to locate their home continent and sketch the boundaries of the surrounding plate in their physical logbooks.
Trace Motion Vectors and Classify Boundary Margins
Activate vector arrows on the map to visualize annual plate velocity and movement directions. Students categorize three distinct boundary segments as convergent, divergent, or transform based on vector orientation.
Overlay Global Volcanic and Earthquake Activity
Toggle the global seismicity and active volcano layers. Students immediately discover that more than seventy-five percent of active volcanoes and ninety percent of earthquakes cluster along the Pacific Plate margin, revealing the famous Ring of Fire.
Formulate Hypotheses and Test in Volcano Island
Transition from the macro-level map to Volcano Island Level 1 and Level 4. Students adjust mantle convection speed and observe how crustal drag accelerates fault rupture, recording their experimental conclusions in their field journals.
The Underlying Geophysics Engine: Convection Cells and Slab Pull
A common misconception among students is that tectonic plates float on a boiling sea of molten magma like rafts on a river. In reality, Earth mantle is solid rock subjected to immense temperatures and confining pressures, causing it to deform plastically over millions of years.
Two primary forces drive the movement seen on any plate tectonics interactive map: thermal convection and gravitational slab pull. Thermal convection occurs because heat from Earth core warms the lower mantle, causing hot rock to become buoyant and slowly rise. As it nears the lithosphere, it cools, increases in density, and sinks back toward the core.
However, modern geophysics research demonstrates that slab pull is the dominant driving mechanism. Because oceanic lithosphere cools and thickens as it migrates away from divergent ridges, it eventually becomes denser than the underlying asthenosphere. When it plunges into a subduction zone, the cold, heavy slab acts like a lead weight, gravitationally pulling the rest of the oceanic plate behind it into the trench.
In Volcano Island, students manipulate both mantle convection currents and plate density gradients. Seeing these dual forces in an interactive 3D physics sandbox cements why continents drift across geological epochs.
Experience the mechanics of subduction trenches and mantle convection firsthand. Adjust plate density, increase slab pull forces, and observe how crustal friction generates volcanic magma chambers.
Launch Level 4 SimulationFrequently Asked Questions About Plate Tectonics Interactive Maps
Here are answers to the most common questions science teachers, homeschool parents, and students ask when using a digital interactive plate boundary map in their curriculum:
What is a plate tectonics interactive map?
How do lithospheric plates move relative to each other?
Why are active volcanoes concentrated along plate boundaries?
Can students use this interactive map on school Chromebooks or tablets?
Download the Free 24-Page Field Geologist Logbook
Printable boundary mapping worksheets, fault identification tables, and cross-section graphing exercises designed to accompany our 3D interactive map.