
From Greenery to Animals: The First Trophic Leap in Ecosystem Energy
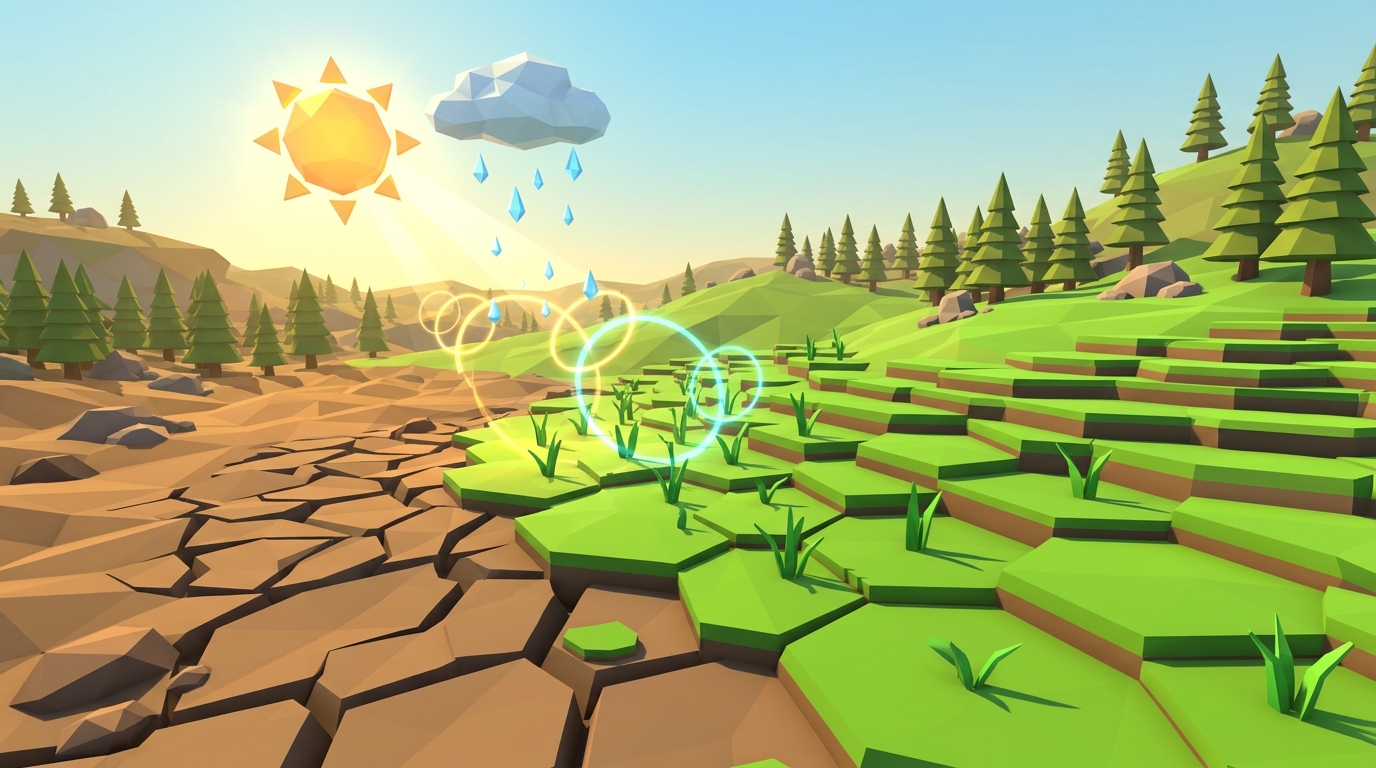
In Level 1 of the Praxos simulation, students discovered how abiotic factors (sunlight and rain) turn bare dirt into a lush carpet of green grass. But an ecosystem consisting only of plants is like a power plant with no machines plugged into it. The solar energy stored within glucose molecules remains locked away until the arrival of the primary consumers.
Under the laws of physics, animals cannot synthesize carbohydrates out of thin air. They are heterotrophs: organisms that must consume external biomass to fuel cellular respiration, locomotion, and bodily maintenance. When a rabbit bites a tuft of grass, it initiates the foundational energy transfer that powers every terrestrial food chain on Earth.
In curricula aligned with NGSS MS-LS2-1, students explore how resource availability dictates population limits. Primary consumers represent the indispensable biological bridge: without herbivores digesting fibrous plant cellulose and converting it into digestible animal protein, neither secondary carnivores nor apex predators could exist.
Primary producers capture solar energy directly; primary consumers harvest that energy by eating plants. Because every grazing bite removes vegetative biomass, animal survival depends on the regeneration speed of the pasture.
The Bathtub Resource Principle: Inflow Growth vs. Outflow Consumption Rates
To help young scientists understand how herbivores impact an ecosystem, systems theorists use the classic Bathtub Model. Think of the meadow's green grass as water filling a bathtub.
The water faucet represents the natural plant growth rate: the inflow of new vegetative biomass driven by sunlight and rain. The drain at the bottom of the tub represents the herd's grazing rate: the continuous outflow of biomass being eaten by hungry herbivores.
As long as the faucet pours in water faster than the drain removes it, the water level remains high and stable. However, if you open the drain too wide by cramming 20 hungry rabbits onto a small pasture, the outflow drastically exceeds the inflow. The bathtub empties, the meadow turns to barren dirt, and every animal starves to death.
| Herd Density Category | Initial Rabbits | Grass Outflow vs. Inflow Rate | Ecosystem Outcome at Day 45 |
|---|---|---|---|
| SUB-CAPACITYUndergrazed (Sparse Foraging) | 1 to 3 Rabbits | Outflow < 15% of daily plant regrowth; near-zero pasture pressure | Grass stays at 95%+ coverage; low genetic diversity; excess biomass |
| GOLDEN HARMONYBalanced Herd (Sustainable) | 6 to 10 Rabbits | Outflow balances inflow; grass grazed down to healthy sustainable level | Rabbits survive with high energy; grass remains between 50% and 75% |
| DEPLETION CRISISOvercrowded (Resource Depletion) | 16 to 20 Rabbits | Outflow exceeds plant regrowth by 250%; rapid pasture defoliation | Grass collapses below 30%; mass starvation; level failure |
The Mechanics of Level 02: Guiding the First Guests Across 45 Days
In Level 02 (First Guests), the terrain begins in a state of pristine beauty: 100% lush green grass coverage across all 100 tiles of the 3D grid, with Sunlight and Rain locked at optimal levels (0.90). The student controls a single variable: the Starting Rabbits slider (0 to 20 individuals, defaulting to 0).
Once released, each low-poly rabbit moves autonomously using a foraging search vector, seeking the closest patch of green grass. Each grazing bite removes 25% of that cell's biomass and restores the rabbit's internal calorie reserves. If a rabbit's energy bar drops to zero, it perishes from starvation.
The mission objective is precise: keep at least 3 rabbits alive through Day 45 while ensuring overall meadow grass coverage never drops below 30%. Students test three distinct hypotheses before pressing Play:
Hypothesis A: The Balanced Herd (6 to 10 Rabbits)
Set Starting Rabbits between 6 and 10 (cohort average 9.1). The rabbits spread across the field, grazing grass cells down while allowing visited tiles time to regrow. Grass remains comfortably between 50% and 70%, securing an easy 3-star victory at Day 45.
Hypothesis B: The Overcrowded Pasture (20 Rabbits)
Max out the slider to 20 rabbits. With twenty mouths eating simultaneously, the grazing outflow outpaces plant mitosis. By Day 18, grass coverage plunges below the 30% failure threshold, triggering an emergency overgrazing alarm.
Hypothesis C: The Lone Forager (1 to 2 Rabbits)
Set Starting Rabbits to 1 or 2. The lone foragers have endless food and grass stays above 95%, but the student barely stresses the ecosystem and learns little about system limits.
Start Level 1 free to launch the simulation engine, or advance straight to Level 2 to test sustainable grazing dynamics in real-time 3D.
Launch Free Ecosystem LabThe Dual-Format Advantage: Formulating Energy Budgets on Paper
When students only interact with digital software, they often treat biological models like arcade games: sliding values up and down until they stumble across a winning number by chance. Praxos eliminates this shallow pattern through our physical Expedition Science Journal.
Before touching the screen, the student writes their pre-run prediction in their notebook: "If I introduce 8 rabbits to a meadow of 100 grass cells, then grass coverage will stabilize around 60% because natural regrowth will match daily grazing consumption."
As the 45-day simulation runs, the student records live data points at Day 15, Day 30, and Day 45. They sketch the declining grass curve and the corresponding rabbit energy survival bar. By translating visual 3D behavior into quantitative tables on paper, young learners build authentic scientific intuition.
Student Reflection Prompt: Calculate your herd's consumption rate. If each rabbit eats one bite of grass every 2 days, how many total bites does a herd of 8 rabbits consume over a 45-day mission?
Frequently Asked Questions About Primary Consumers and Level 02
Answers to common questions from homeschooling parents and middle-school science teachers introducing herbivore biology.
Why is reproduction disabled in Level 2?
What happens when a rabbit runs out of food in the simulation?
What is the most common mistake students make in Level 2?
How does Level 2 bridge into Level 3 and Level 4?
Level 2 Mission Log & Herbivore Calorie Tracker (PDF)
A printable 24-page Expedition Science Journal featuring structured prediction hypotheses, daily population logs, and herbivore energy survival curves.