Why Static Food Chain Diagrams Fail Young Learners
Picture a standard 5th-grade science lesson on ecology. A teacher hands out a printed worksheet showing a blade of grass, an arrow pointing to a grasshopper, an arrow pointing to a frog, and an arrow pointing to a hawk. The students memorize the definitions: producer, primary consumer, secondary consumer, apex predator. They complete the multiple-choice quiz, earn their grade, and promptly forget the concept two weeks later.
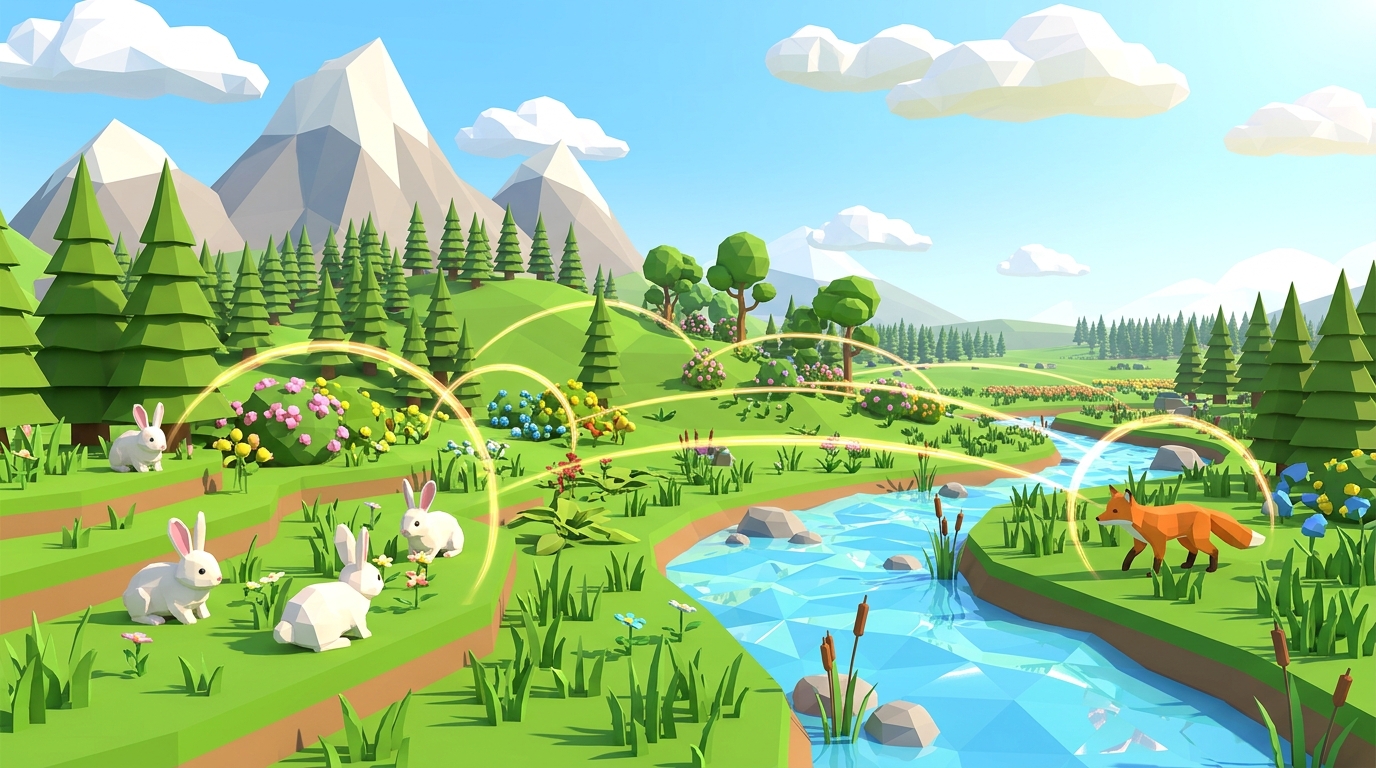
Why does this happen? Because static, one-directional diagrams represent nature as a rigid linear conveyor belt rather than an interconnected, fluctuating web. In the real world, grass does not grow at a constant rate; it depends on sunlight and soil moisture. Grasshoppers do not eat politely in single-file lines; their population booms until food runs out, triggering sudden crashes. When students look at a flat picture, they cannot see feedback loops, time delays, or carrying capacity limits in action.
Linear arrows create the false assumption that nature operates in straight lines. Real ecosystems operate on delayed feedback loops, carrying capacities, and dynamic balance.
What an Interactive 3D Simulation Adds to Science Learning
An interactive 3D food chain simulation replaces passive memorization with active inquiry. When a student opens a digital ecology lab, they are no longer just looking at a picture: they are stepping into the role of an environmental systems manager.
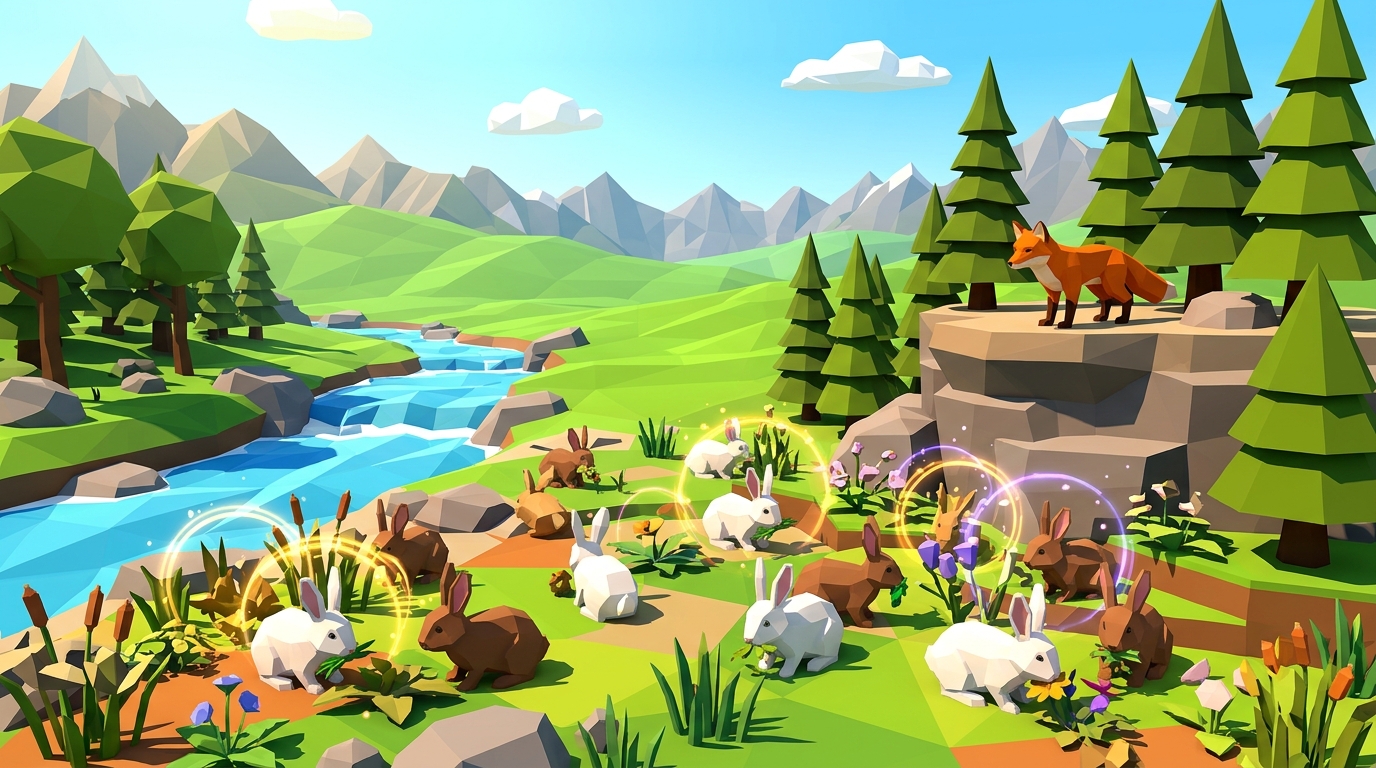
In a deterministic simulation engine running daily time steps, every action produces an immediate biological reaction. If a student dials down sunlight by 50%, vegetation growth slows within days. If rabbits continue grazing at full speed, plant biomass drops below the survival threshold, triggering starvation, reproductive collapse, and population decline. The student does not read about carrying capacity; they watch the live population curve peak, stall, and plummet on screen using interactive food chain games.
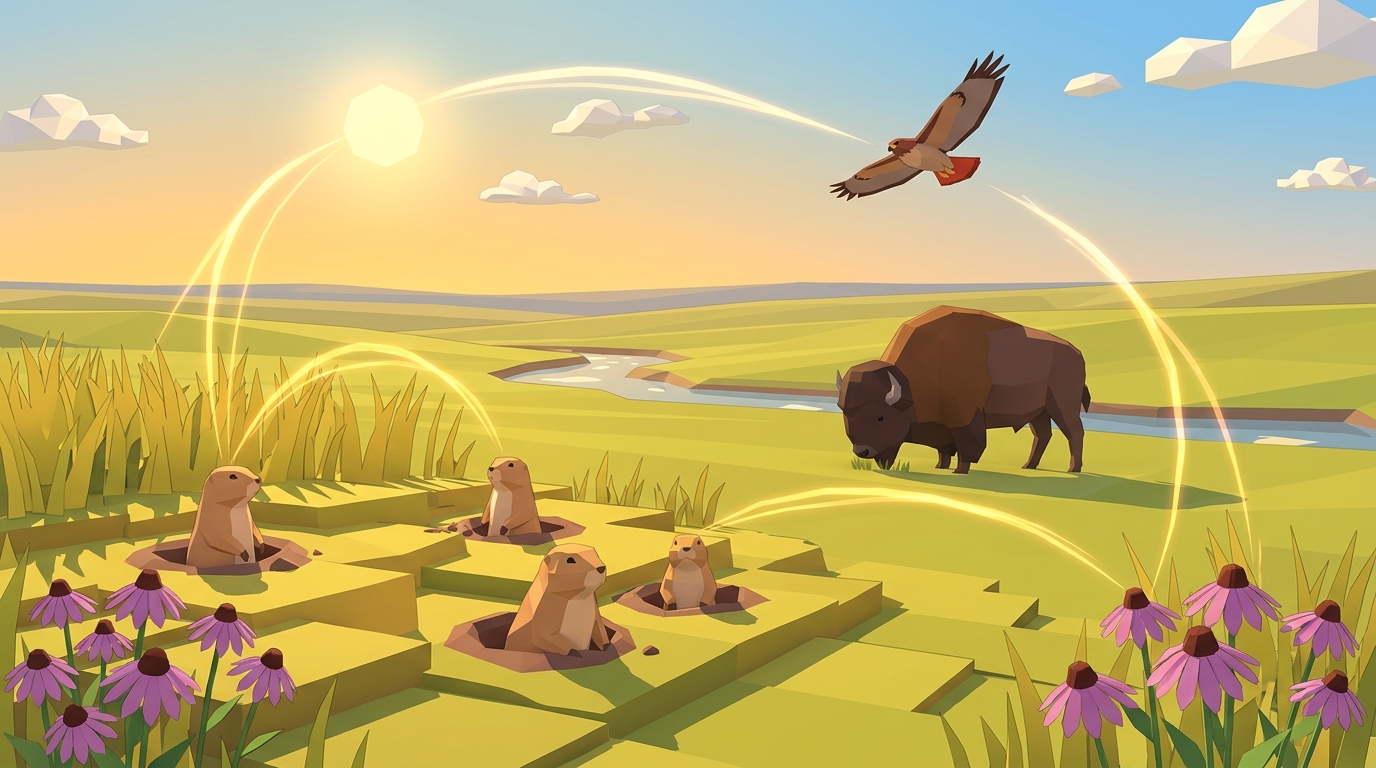
When a child turns down a sunlight slider and watches a virtual meadow turn brown, they are not memorizing biology vocabulary. They are experiencing the fundamental laws of thermodynamics and trophic energy transfer firsthand.
5 Core Ecological Concepts Kids Master in a 3D Simulation
By manipulating live environmental variables across structured progressive missions, students build an intuitive, lasting grasp of five foundational NGSS life science concepts:
1. Abiotic-Biotic Coupling: Understanding how non-living energy inputs (sunlight and precipitation) dictate the maximum biomass potential of the entire ecosystem.
2. The 10% Trophic Energy Rule: Observing why thousands of plant units are required to feed hundreds of herbivores, which in turn can only support a handful of apex predators.
3. Boom-and-Bust Population Dynamics: Discovering why unchecked herbivore reproduction inevitably leads to resource depletion, starvation, and sudden population crashes.
4. Top-Down Trophic Cascades: Learning that apex predators (like wolves or hawks) are not villains but vital ecosystem guardians that prevent herbivores from destroying vegetation, as illustrated by Yellowstone wolves.
5. Dynamic Equilibrium & Wave Oscillations: Seeing that a healthy food web is never static; predator and prey populations naturally rise and fall in rhythmic, self-correcting waves.
Food Chain & Food Web Activity: The 3-Step Inquiry Method
To ensure digital simulations build genuine scientific intuition rather than turning into mindless screen clicking, Praxos uses a structured 3-step inquiry framework combining physical science journals with 3D modeling:
The Pencil-First Prediction (5 Minutes)
Before touching any simulation controls, the student reads the mission objective in their physical lab journal and writes a concrete hypothesis in pencil. For example: If I increase starting herbivores to 40 without increasing grass growth, the vegetation will drop below 20% by Day 25. Writing before clicking creates mental ownership.
The Digital Simulation Trial (20 Minutes)
The student runs the 3D lab, carefully adjusting their chosen variables while keeping constants locked. They observe the visual 3D biome while monitoring the live 2D population trend chart to test their hypothesis against real-time data.
Logbook Reflection & Analysis (5 Minutes)
The student records final population numbers, calculates the margin of error between their prediction and actual outcomes, and answers the guided prompt: Why did the herbivore population crash on Day 18?
Traditional Learning vs. 3D Simulation Learning
Here is how traditional science instruction compares with dynamic 3D simulation learning across key educational metrics:
| Learning Metric | Static Textbook / Worksheets | 2D Flash-Style Quizzes | Praxos 3D Simulation Lab |
|---|---|---|---|
| Cognitive Mode | Passive memorization of terms | Trial-and-error guessing | Hypothesis-driven scientific inquiry |
| Real-Time Feedback | None (delayed grading) | Correct/Incorrect chime | Live 3D reaction & population graph |
| Systems Thinking | Linear (isolated steps) | Linear (drag-and-drop matching) | Complex multi-variable feedback loops |
| Curriculum Retention | Low (forgotten after test) | Moderate (visual recall) | High (grounded in cause-and-effect) |
| Physical Balance | 100% paper (often dry) | 100% screen (causes fatigue) | Dual-format: 3D lab + physical journal |
| 100% FREECost & Accessibility | Free or standard book fee | Ad-supported or paywalled | 100% Free (All 10 levels & full journal) |
Launch Your First Food Chain Experiment Today
You do not need an expensive laboratory kit or district software license to bring dynamic ecology to life. All 10 simulation missions in Praxos Ecosystem and the complete 24-page Expedition Science Journal are 100% free with email.
Level 1 opens instantly in any modern web browser with zero registration, zero downloads, and zero ads. Give your students a real scientific laboratory and watch complex ecology concepts click in minutes.
Experience real-time trophic energy modeling in your browser right now. No login or credit card required.
LAUNCH SIMULATION LABFree 24-Page Expedition Science Journal
Pair your simulation trials with structured hypothesis sheets, population graphing grids, and reflection prompts designed for grades 3-8.