The Mystery of the Vanishing Energy: Why Are Apex Predators So Rare?
Step into any wilderness forest, open prairie, or African savanna, and a striking ecological pattern immediately stands out: thousands of blades of grass and leafy shrubs cover the soil, hundreds of herbivorous insects and rodents scurry through the brush, dozens of small predators hunt in the undergrowth, but you might only see one or two apex carnivores across several square miles.
Why are top predators like eagles, wolves, and tigers so extraordinarily scarce compared to the animals they hunt? The answer is not that herbivores are better breeders or that carnivores have fewer babies. The fundamental constraint is thermodynamic: energy vanishes as it ascends the food chain.
To help middle school students visualize this loss, I use the analogy of a leaky bucket brigade: imagine a line of firefighters attempting to extinguish a blaze using leaky buckets. The first person at the well fills a five-gallon bucket to the brim. But every time the bucket is handed to the next person down the line, ninety percent of the water sloshes out onto the dirt. By the time the bucket reaches the fourth person at the fire, only a tiny splash remains in the bottom. In living systems, that leaking water is metabolic cellular respiration, and the tiny splash at the end is all that remains to support an apex predator.
The Laws of Thermodynamics: Where Does the Missing 90% Go?
Middle school life science students frequently harbor a common misconception: they assume that when an animal eats food, 100% of that food is converted into new body weight. But the physical laws of nature dictate otherwise:
1. The First Law of Thermodynamics (Conservation of Energy): Energy cannot be conjured from nothing nor can it be destroyed; it can only change form. Plants capture radiant photons of sunlight and convert them into chemical potential energy stored in the covalent bonds of glucose. When a rabbit eats the plant, that chemical energy is transferred, perfectly balancing the planetary energy ledger.
2. The Second Law of Thermodynamics (Entropy and Inevitable Heat Loss): No energy transformation in the universe is 100% efficient. Every time energy shifts form, a portion is degraded into low-grade, disordered thermal energy (heat). Because living cells cannot harness diffuse environmental heat to perform mechanical work, that thermal energy radiates into the atmosphere and is permanently lost from the biological food web.
So where does the missing ninety percent actually go? Ecological field studies reveal three primary pathways of loss:
First, Cellular Respiration and Basal Metabolism: The vast majority of ingested calories (often 60% to 70%) are burned immediately in the mitochondria to generate ATP. This fuel powers heart contractions, brain function, nervous impulses, active cellular transport, and in endothermic birds and mammals, constant thermoregulation to maintain a warm core body temperature.
Second, Indigestible Waste and Egestion: Animals cannot digest every part of what they consume. Herbivores consume cellulose, lignin, and woody plant matter that passes straight through their digestive tracts as feces. Carnivores ingest bones, teeth, claws, and fur. This chemical energy never enters the animal's somatic cells; instead, it is diverted to soil decomposers and detritivores.
Third, Foraging and Locomotion Costs: Finding food requires burning food. A predator often expends enormous calories running, tracking, and fighting prey. Only the small leftover surplus (roughly 10% on average) is stored as newly synthesized protein, muscle, and adipose tissue available to be eaten by the next trophic tier.
Comparing Pyramids: Energy vs. Biomass vs. Numbers
In ecological modeling, scientists utilize three distinct ecological pyramids to measure ecosystem structure. Understanding the difference prevents deep student confusion:
Pyramid of Numbers: This graphic counts individual living organisms at each level. While often pyramid-shaped, a pyramid of numbers can easily become inverted. For example, a single massive oak tree (one producer) can support 100,000 herbivorous caterpillars, creating an upside-down pyramid base.
Pyramid of Biomass: This diagram measures the dry organic weight (grams per square meter) of all organisms at each tier. In terrestrial ecosystems, biomass pyramids are almost always upright. However, in marine pelagic biomes, the biomass pyramid can invert temporarily: microscopic phytoplankton reproduce and die so rapidly that a small standing crop of phytoplankton can support a larger biomass of longer-lived zooplankton and fish.
Pyramid of Energy: Unlike numbers or biomass, a pyramid of energy can NEVER be inverted under any circumstances. Energy represents productivity: the total number of kilocalories generated per square meter per year. Because of the unbreakable Second Law of Thermodynamics, the amount of energy flowing through an upper level can never exceed the energy available at the level below it.
Comparative Analysis: Trophic Levels and Caloric Degradation
The table below illustrates Lindeman efficiency across a standardized temperate meadow biome starting with 10,000 kilocalories per square meter per year of net primary autotrophic production:
| Trophic Level | Ecological Role | Meadow Biome Examples | Available Energy (kcal/m2/yr) | Energy Retained from Sun | Primary Metabolic Cost |
|---|---|---|---|---|---|
| Autotrophic BaseLevel 1: Primary Producers | Autotrophs (Solar Conversion) | Clover, Orchard Grass, Wildflowers | 10,000 kcal | 100% of captured solar baseline | Cellular maintenance & cellulose cell walls |
| Level 2: Primary Consumers | Herbivores (Vegetation Grazers) | Cottontail Rabbits, Field Voles, Grasshoppers | 1,000 kcal | 10.0% of autotrophic baseline | Digesting cellulose, constant foraging, escaping predators |
| Level 3: Secondary Consumers | Primary Carnivores / Insectivores | Garter Snakes, Toads, Praying Mantises | 100 kcal | 1.0% of autotrophic baseline | Active hunting, venom synthesis, digestive metabolism |
| Level 4: Tertiary Consumers | Secondary Carnivores | Red Foxes, Barn Owls, Weasels | 10 kcal | 0.1% of autotrophic baseline | Territory defense, tracking prey across square miles |
| Level 5: Quaternary Apex Predators | Apex Carnivores (Top of Food Chain) | Golden Eagles, Mountain Lions | 1 kcal | 0.01% of autotrophic baseline | High-speed flight, immense home range patrol |
| Decomposers & Detritivores | Nutrient Recyclers | Earthworms, Soil Fungi, Bacteria | Varies (Consumes all unassimilated waste) | Recycles organic matter | Breaks down non-living organic biomass into inorganic minerals |
Simulate Trophic Energy Flow in Interactive 3D
Take command of solar irradiance, plant photosynthesis efficiency, and herbivore metabolic burn rates in real time. Track individual Joules of energy flowing from meadow grass to grazing rabbits and observe why predator populations collapse when producer energy drops.
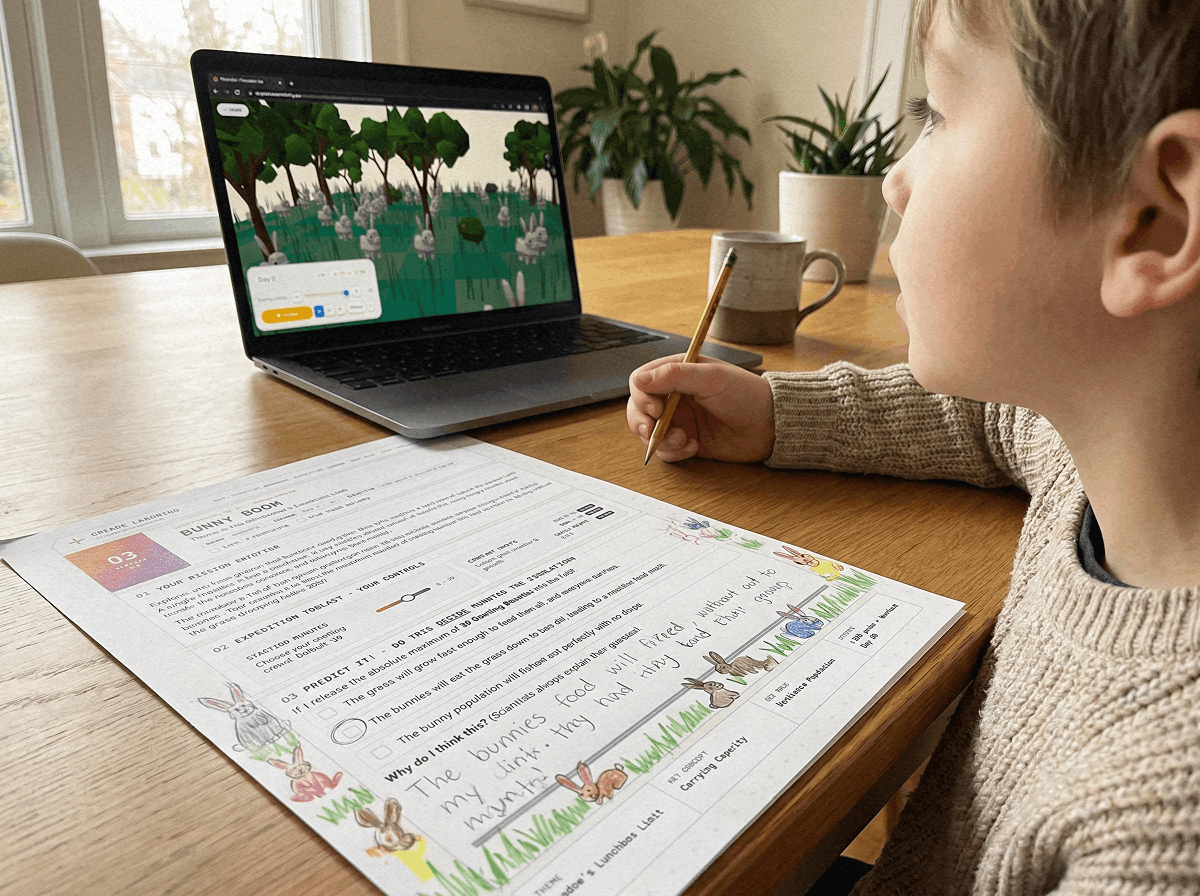
Teaching this topic tomorrow? Download the Free NGSS Student Lab Sheet (Printable PDF)
Equip your middle school biology students with printable trophic level calculation worksheets, biomass-energy comparison grids, and NGSS MS-LS2-3 inquiry lab pages.
Hands-On Classroom Inquiry: 4-Step Trophic Calorie Balance Protocol
When teaching NGSS MS-LS2-3 (Ecosystem Energy Flow and Matter Cycling), having students simply multiply numbers by 0.10 on paper leaves them disconnected from the real living consequences. In EcoChaos Level 1, I built interactive calorie trackers so students can manipulate solar variables and measure real-time population collapses:
Establish Solar Baseline and Plant Biomass
Begin by setting solar irradiance to 100% in EcoChaos Level 1. Have students observe the growth rate of meadow clover and calculate the baseline calories generated by the primary producer layer.
Introduce Herbivore Grazers and Track Metabolic Expenditure
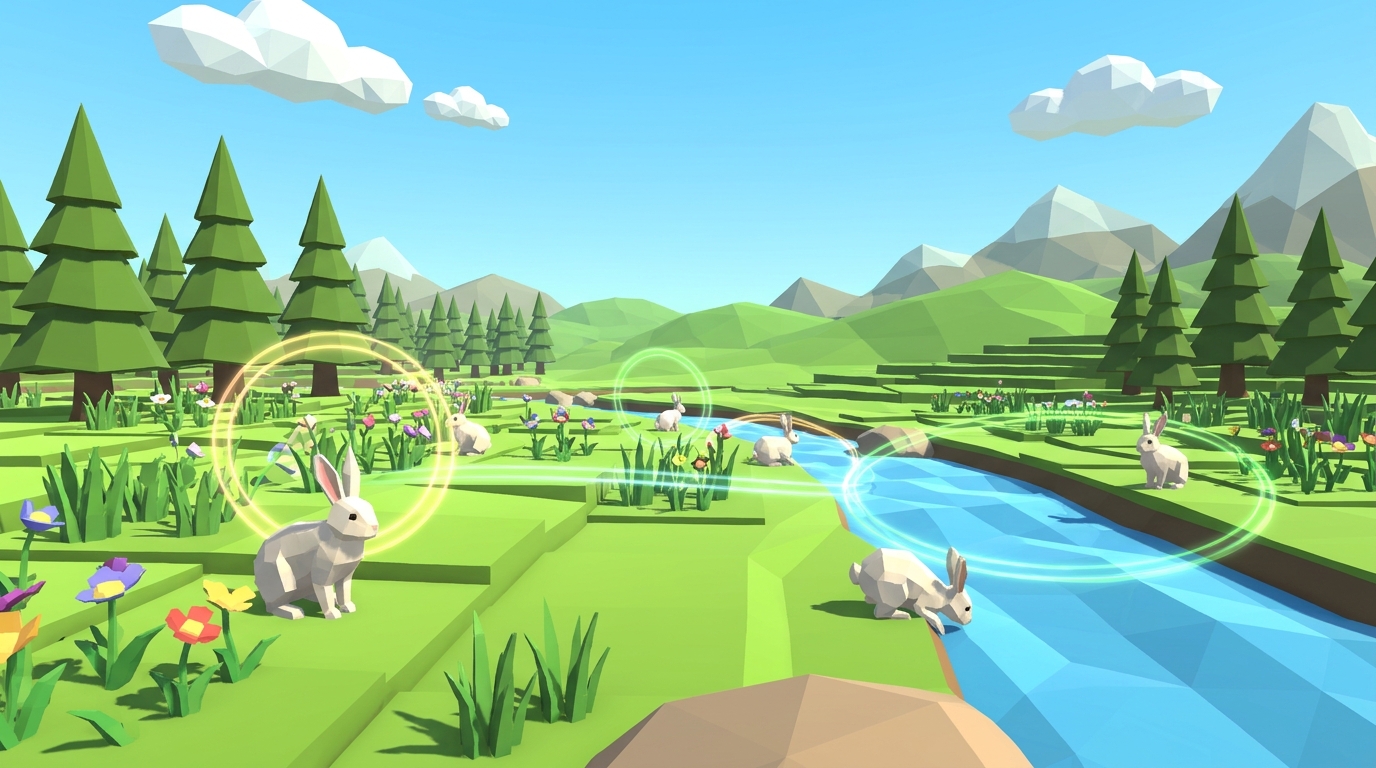
Introduce 20 cottontail rabbits to the meadow. Monitor the live calorie graph to see how much energy is consumed versus how much radiates away as body heat. Verify that only roughly 10% of plant calories are successfully converted into new rabbit offspring.
Simulate Apex Carnivore Starvation Chokepoints
Add a pair of red foxes to the simulation. Have students calculate whether the rabbit population can produce enough harvestable calories per week to keep the foxes alive without going extinct.
Analyze Food Chain Length Limits and Human Diet Efficiency
Ask students to attempt adding a Level 5 apex eagle to the meadow without increasing the sunlight slider. Watch the eagle starve within two simulation weeks, demonstrating why food chains cannot extend indefinitely.
Frequently Asked Questions About Energy Pyramids & The 10% Rule
Explore common educator and student questions regarding ecological efficiency, trophic cascades, and caloric transfer:
Why is the transfer efficiency called the 10% rule if actual ecosystems vary?
Why are wild food chains almost never longer than four or five trophic levels?
Can an energy pyramid ever be inverted like a biomass pyramid?
How does human food consumption connect to the 10% rule?
Related Life Science Guides and Interactive Laboratories
Continue expanding your middle school ecology and life science curriculum with our companion interactive guides:
Explore population limits and limiting factors in our carrying capacity simulation guide.
Test herbivore-plant equilibrium in our free ecosystem simulation game.
Investigate predator-prey balance in our trophic cascade simulation online.
Compare classroom software in our food chain interactive games directory.
Explore our complete 20-level hands-on life science homeschool curriculum options.
Download the Free 24-Page Student Science Journal
Equip your middle school biology students with printable trophic level calculation worksheets, biomass-energy comparison grids, and NGSS MS-LS2-3 inquiry lab pages.