How Wolves Changed Rivers: The Iconic Yellowstone Ecological Cascade
In 1995, wildlife biologists in Yellowstone National Park carried out one of the most famous ecological experiments in modern history: they reintroduced gray wolves after a 70-year absence. During the decades wolves were missing, deer and elk populations had multiplied out of control, overgrazing the valley bottoms, eating young willow and aspen shoots, and stripping the riverbanks bare.
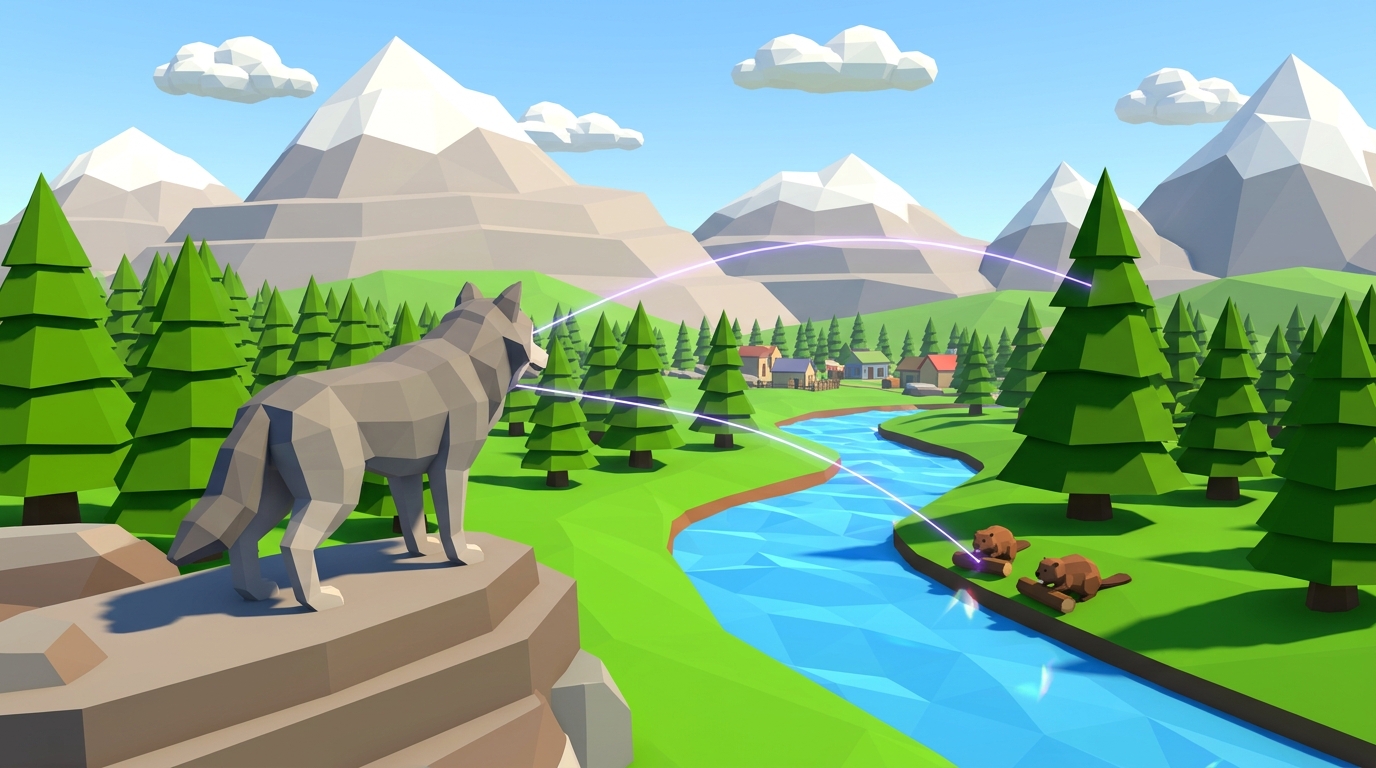
When wolves returned, something extraordinary occurred. Wolves did not simply reduce deer numbers: they changed deer behavior. Grazers began avoiding exposed valley bottoms and river canyons where they could be easily ambushed. In response, willow and aspen trees quintupled in height in just six years. Songbirds returned. Beavers returned to build dams using the new trees, creating habitats for otters, ducks, and fish. Tree roots stabilized the soil, stopping riverbanks from collapsing and literally altering the flow of the rivers.
This phenomenon is called a trophic cascade: an ecological process that starts at the top of the food chain and tumbles all the way down to the bottom. For kids ages 7 to 12, hearing this story is fascinating, but being able to simulate it and manipulate the predator numbers themselves makes the insight permanent.
Step into Level 4 (The Gray Shadow) to introduce wolves and foxes into an overpopulated grassland. Watch vegetation recover in 3D. All 10 levels are 100% free with email.
LAUNCH TROPHIC CASCADE LABSimulating Trophic Cascades in 3D: Inside Praxos Level 4 & Level 10
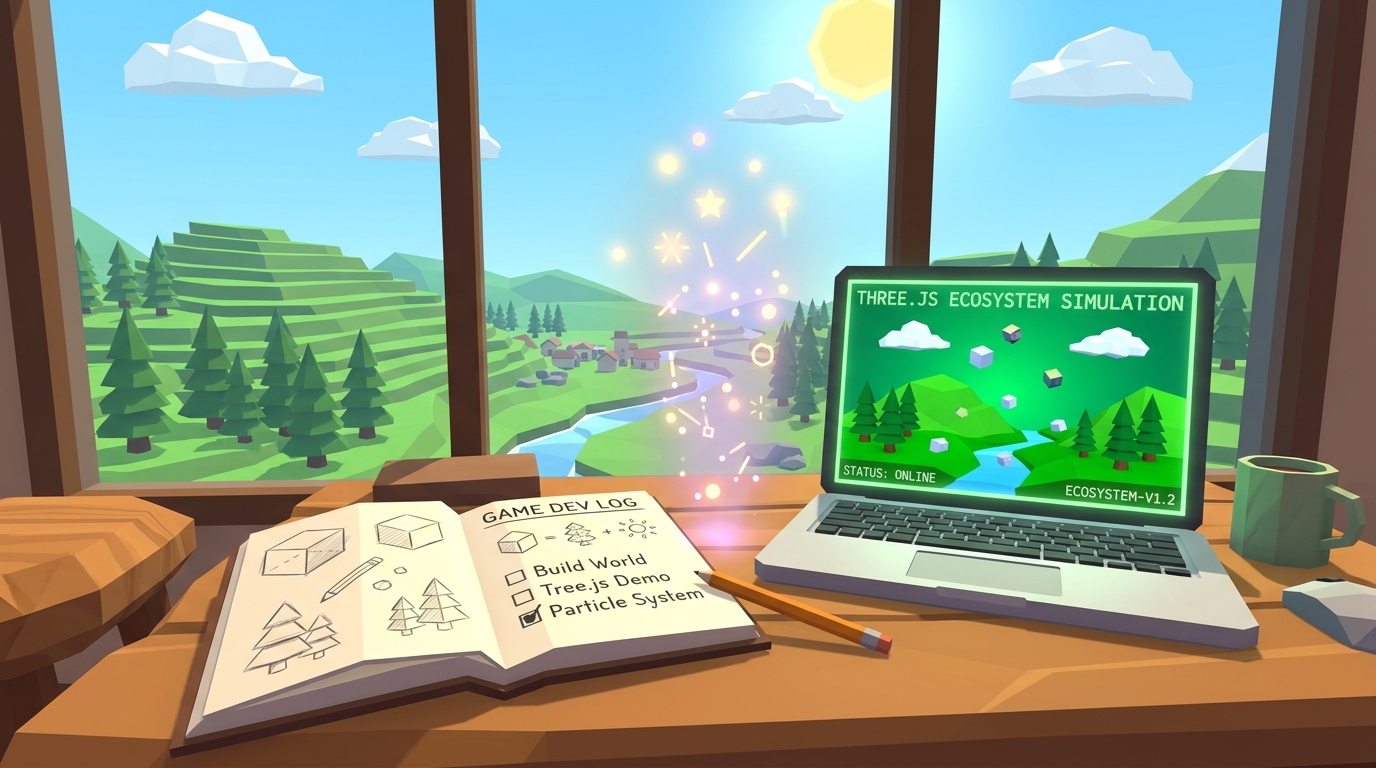
I designed the Praxos simulation engine so kids can test ecological theories through direct variable manipulation rather than passive memorization. Trophic cascades come alive across two key missions:
Mission 04 (The Gray Shadow): The Apex Predator Test. Kids receive an ecosystem where primary consumers (rabbits and deer) are approaching carrying capacity overshoot, depleting grass biomass. Students introduce wolves and foxes at custom population densities. As predators begin hunting, students watch a visual wave of relief spread across the landscape: grazing pressure drops, grass regrowth rates surge, and a balanced dynamic equilibrium forms.
Mission 10 (Ecosystem Resilience & Keystone Removal): The Tipping Point Lab. In this capstone mission, students test what happens when an established apex predator is removed from a mature ecosystem. They record how many simulation ticks pass before herbivore overpopulation triggers grass starvation, demonstrating why keystone predators are essential for long-term biodiversity.
Throughout each mission, students track real-time 2D population trend lines underneath the 3D canvas, watching the delayed oscillation wave: predator introduction, herbivore decline, vegetation rebound, and predator stabilization.
Trophic Cascade Teaching & Learning Approaches Compared
Here is an objective comparison of different classroom and homeschool methods used to teach trophic cascades and keystone species dynamics:
| Teaching Approach | Hands-On Control | Real-Time Dynamics | Data Depth | Cost |
|---|---|---|---|---|
| Yellowstone video documentary only | Low (passive viewing) | High (cinematic video) | None (qualitative only) | Free on YouTube |
| Paper food chain arrow diagrams | Low (pencil and paper) | None (static drawings) | None (vocabulary focus) | Free / Low |
| Predator-prey bean counting activity | Moderate (physical counters) | Slow (manual turn-based steps) | Inconsistent (counting errors) | Low (beans/dice) |
| 100% FREEPraxos 3D Trophic Cascade Simulator | Very High (live sandbox controls) | Real-time 60 FPS feedback | Quantitative (live population curves) | Free (all levels + journal) |
45-Minute Apex Predator Investigation & Yellowstone CER Lab
This guided science lesson connects the historical Yellowstone case study to an active 3D lab simulation. It fits within a single standard 45-minute class period or home study block:
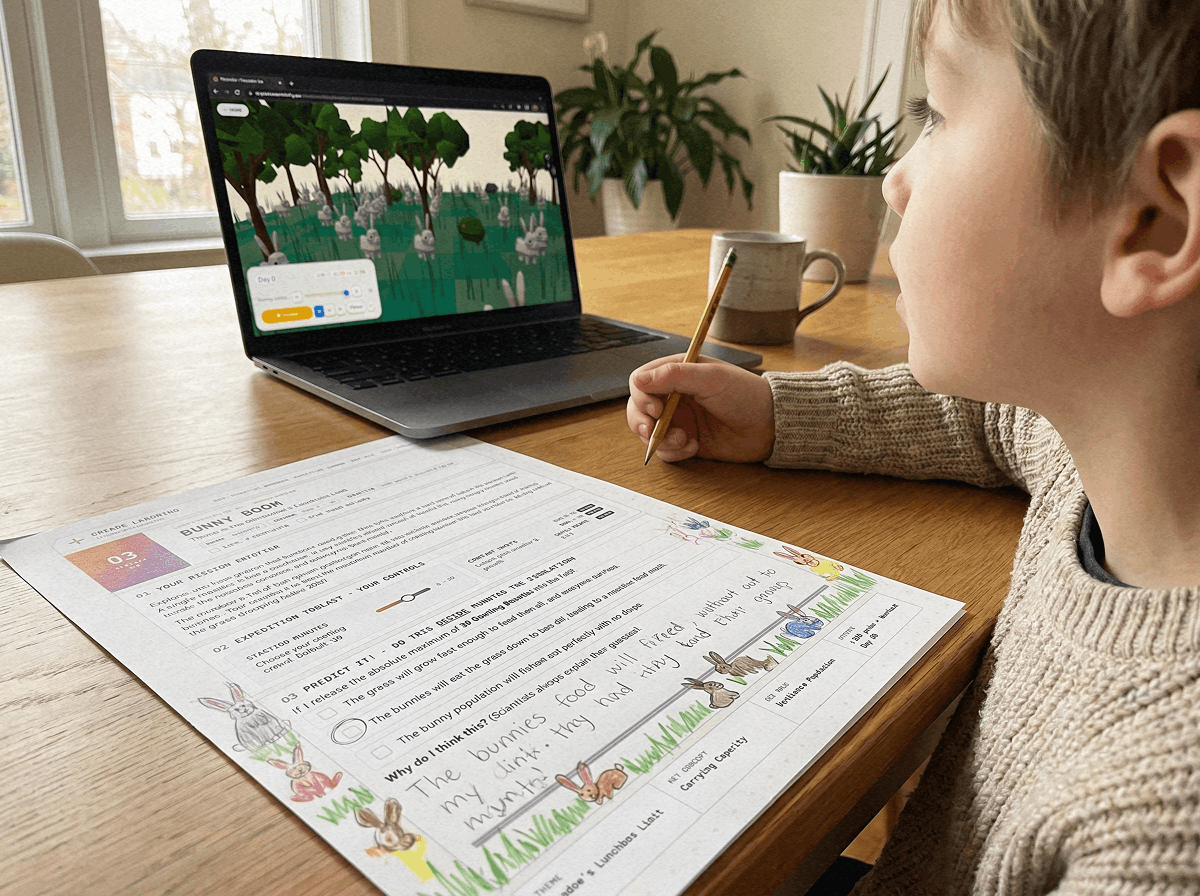
Part 1: Yellowstone Hook & Hypothesis (10 minutes). Introduce the Yellowstone wolf reintroduction story (or watch a short 4-minute video clip). Distribute the free 24-page Expedition Science Journal. Students write their hypothesis: "If apex predators are added to an overpopulated ecosystem, I predict the plant population will (increase / decrease) because _____."
Part 2: Three-Trial Trophic Simulation (20 minutes). Students open Level 4 and run three distinct trials: Trial A (Zero predators: recording maximum herbivore population and minimum grass cover). Trial B (Moderate predator pack: recording the tick at which herbivore numbers decline and grass begins regenerating). Trial C (Over-predation test: introducing excessive predators to see if prey extinction occurs). Students log population numbers at ticks 10, 20, 30, 40, and 50.
Part 3: CER Written Synthesis (15 minutes). Students write a formal Claim-Evidence-Reasoning summary in their journal. Claim: How do wolves paradoxically increase plant life in an ecosystem? Evidence: Data comparison between Trial A and Trial B. Reasoning: Explain how top-down predation regulates herbivore grazing habits.
Curriculum Standards & Multi-Age Adaptability (Grades 3-7 / Ages 7-12)
This free trophic cascade simulation directly supports core Next Generation Science Standards across upper elementary and middle school grades:
NGSS 5-LS2-1 (Grade 5): Develop a model to describe the movement of matter among plants, animals, decomposers, and the environment. Level 4 illustrates how predator energy needs connect to herbivore and plant abundance.
NGSS MS-LS2-2 (Grades 6-8): Construct an explanation that predicts patterns of interactions among organisms across multiple ecosystems. Students analyze the predator-prey relationship and top-down regulation mechanisms.
NGSS MS-LS2-4 (Grades 6-8): Construct an argument supported by empirical evidence that changes to physical or biological components of an ecosystem affect populations. The CER journal activity requires students to support their arguments with simulation data.
Level 1 starts instantly in any web browser with zero registration. All 10 levels and the full 24-page printable science journal are 100% free with your email.
Classroom Hardware & Chromebook Frictionless Setup Guide
I built the Praxos platform to work effortlessly on the hardware real schools and families actually own:
Browser Compatibility: Tested on Google Chrome 90+, Microsoft Edge 89+, Apple Safari 14+, and Mozilla Firefox 85+.
Chromebook Ready: Optimized for standard 2GB RAM school Chromebook carts and shared home tablets with zero lag.
No Installation: 100% browser-based WebGL. No app store downloads, extensions, or admin permissions needed.
Student Privacy: Zero student personal information is collected. No student accounts or logins required.
Frequently Asked Questions From Parents & Science Teachers
Answers to common questions about teaching trophic cascades with the Praxos 3D simulation.
What is the simplest way to explain a trophic cascade to a 4th or 5th grader?
Can my whole class run the simulation simultaneously on school Chromebooks?
How does this simulation compare to classic PhET or NetLogo models?
Is this simulation free for homeschool families and teachers?
How long does a complete trophic cascade trial take in the simulation?
Free Supporting Trophic & Ecology Resources
Pair your trophic cascade lesson with these free science guides:
The why wolves saved Yellowstone guide provides a comprehensive historical reading on the 1995 Yellowstone reintroduction project.
The tertiary consumers guide breaks down apex predator roles across grassland, ocean, and forest biomes.
The free food web simulator for kids lets students build full multi-tiered food webs from producers up to raptors.
The prairie ecosystem simulation explores grassland energy balance in interactive 3D.
Get the complete printable trophic cascade and ecology lab journal with prediction sheets, population data tables, and CER written prompts. Formatted for easy black-and-white printing.
GET FREE LAB JOURNAL24-Page Expedition Science Journal
A printable CER lab journal with trophic cascade mapping sheets, population oscillation graphs, and reflection prompts designed for kids ages 7-12.