Linear Food Chains vs Multidimensional Food Webs: The Core Distinction
When science students first encounter ecology, they almost always start with a food chain: green grass captures sunlight, a meadow rabbit eats the grass, and a red fox catches the rabbit. It is tidy, easy to memorize, and completely unrealistic.
Why are food webs more realistic than food chains? Food webs are more realistic than food chains because real organisms rarely eat only one type of food. A food chain depicts an isolated, fragile linear path, whereas a food web maps the complete interconnected network of feeding relationships, showing how biodiversity provides stability.
In any natural habitat, organisms consume diverse diets and are hunted by multiple predators. A red fox does not eat exclusively rabbits; it eats mice, ground-nesting songbirds, beetles, and wild blackberries. By mapping these overlapping pathways, a food web transforms a simplistic cartoon into an accurate computational model of energy flow and ecosystem dynamics.
Food chains depict an imaginary world of single-item diets. Food webs reflect real biological nature, where multiple redundant connections protect populations from sudden collapse when conditions fluctuate.
Why Linear Food Chains Oversimplify Nature: The Fragility Fallacy
The primary flaw of a linear food chain is that it portrays nature as impossibly fragile. In a chain of Grass -> Rabbit -> Fox, if a fungal blight wipes out the grass, the rabbits instantly starve, and the foxes immediately follow.
If real ecosystems operated like single-track assembly lines, life on Earth would have vanished hundreds of millions of years ago following the first localized drought or seasonal frost. Nature persists precisely because ecological architecture is organized as a resilient decentralized network.
When students rely solely on food chain diagrams, they develop three persistent misconceptions: that predators have only one prey target, that animals never compete for multiple food sources, and that omnivores do not exist. Shifting from chains to webs corrects these fundamental misunderstandings.
Three Crucial Ecological Realities Only Food Webs Reveal
Scientists and educators rely on food webs because they illustrate dynamic phenomena that linear diagrams are physically incapable of showing:
| Ecological Feature | Linear Food Chain Representation | Interconnected Food Web Reality | Educational Value |
|---|---|---|---|
| DIET ADAPTATIONDietary Diversity | Single prey species per consumer (e.g. Fox eats only Rabbit) | Multi-species omnivory (Fox eats rabbits, rodents, berries, insects) | Teaches opportunism and seasonal foraging adaptations |
| CORE RESILIENCESystem Resilience | Zero redundancy; if one link breaks, the entire chain crashes | High redundancy; consumers switch to alternative prey if one population drops | Demonstrates why biodiversity prevents ecological collapse |
| TROPHIC FLEXIBILITYTrophic Positioning | Fixed rigid level (always primary, secondary, or tertiary) | Flexible trophic role (an organism can occupy level 2 and level 3 simultaneously) | Explains omnivores, detritivores, and complex food webs |
| ENERGY MAPPINGEnergy Pathways | Single one-way tunnel with 90% loss per step | Interwoven web of primary, secondary, and detrital loops | Models realistic biomass capacity and ecosystem carrying capacity |
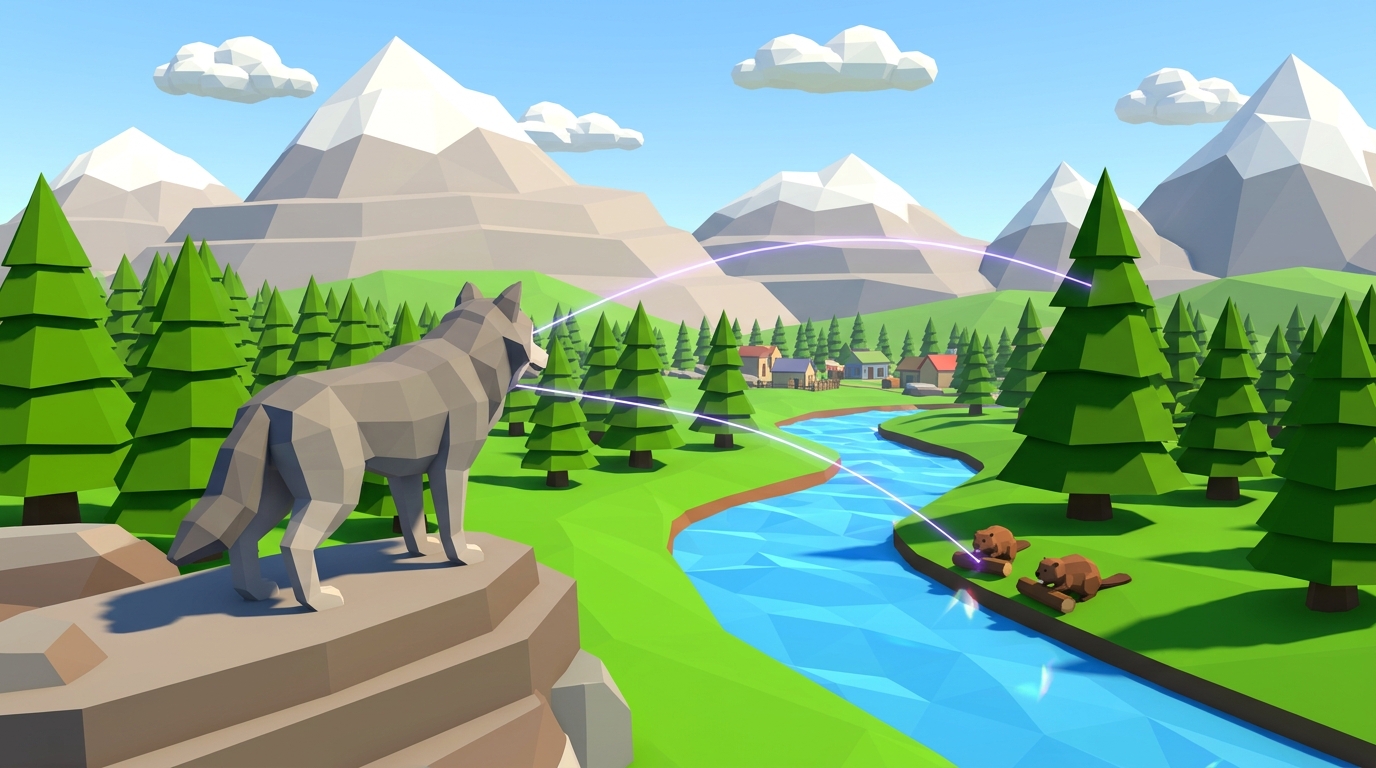
| SYSTEMS THINKINGTrophic Cascades | Shows direct predation only between adjacent links | Reveals indirect ripple effects across non-adjacent organisms | Explains keystone species impacts (e.g. wolves altering river courses) |
The stability of an ecosystem is proportional to the number of alternative energy pathways available to its members. High connectance yields robust ecological buffering.
What Food Web Arrows Actually Mean: Tracing the Flow of Energy
One of the most persistent errors on middle school science exams involves arrow direction. When asked to draw a food web, students instinctively point arrows from the predator to the prey, thinking of the arrow as a pointer showing who is hunting whom.
In biological modeling, the rule is unambiguous: in a food web, arrows point from the organism being eaten toward the organism that consumes it. The arrow represents the physical movement of chemical energy and nutrients.
When grass is eaten by a rabbit, energy stored inside plant glucose molecules enters the rabbit's bloodstream. Therefore, the arrow points from Grass -> Rabbit. When an owl catches a mouse, energy flows from Mouse -> Owl. Memorizing this single rule prevents confusion across all trophic diagram questions.
Arrows indicate: "Gives energy to." An arrow from Berry Bush to Bear means the berries nourish the bear. It never indicates the direction of attack.
Transitioning Learners from Chains to Webs: A 4-Step Inquiry Routine
In guided science lessons, educators transition students from linear chains to dynamic networks through four structured investigation stages:
Build the Single Baseline Chain on Paper
Have the student sketch a single 3-link chain (Clover -> Field Mouse -> Barn Owl) in their physical lab journal. Confirm arrow direction indicates energy transfer.
Introduce Secondary Consumers and Competition
Add a second herbivore (Rabbit) and a second predator (Red Fox). Connect clover to rabbit, and rabbit to both fox and owl. The linear chain begins branching into a web.
Layer in an Omnivore and Decomposer Loop
Add an omnivore like a black bear or opossum that consumes both plant berries and mice. Then add soil bacteria and fungi that feed on dead leaves and carcasses, closing the nutrient loop.
Execute a System Disruption Experiment in 3D
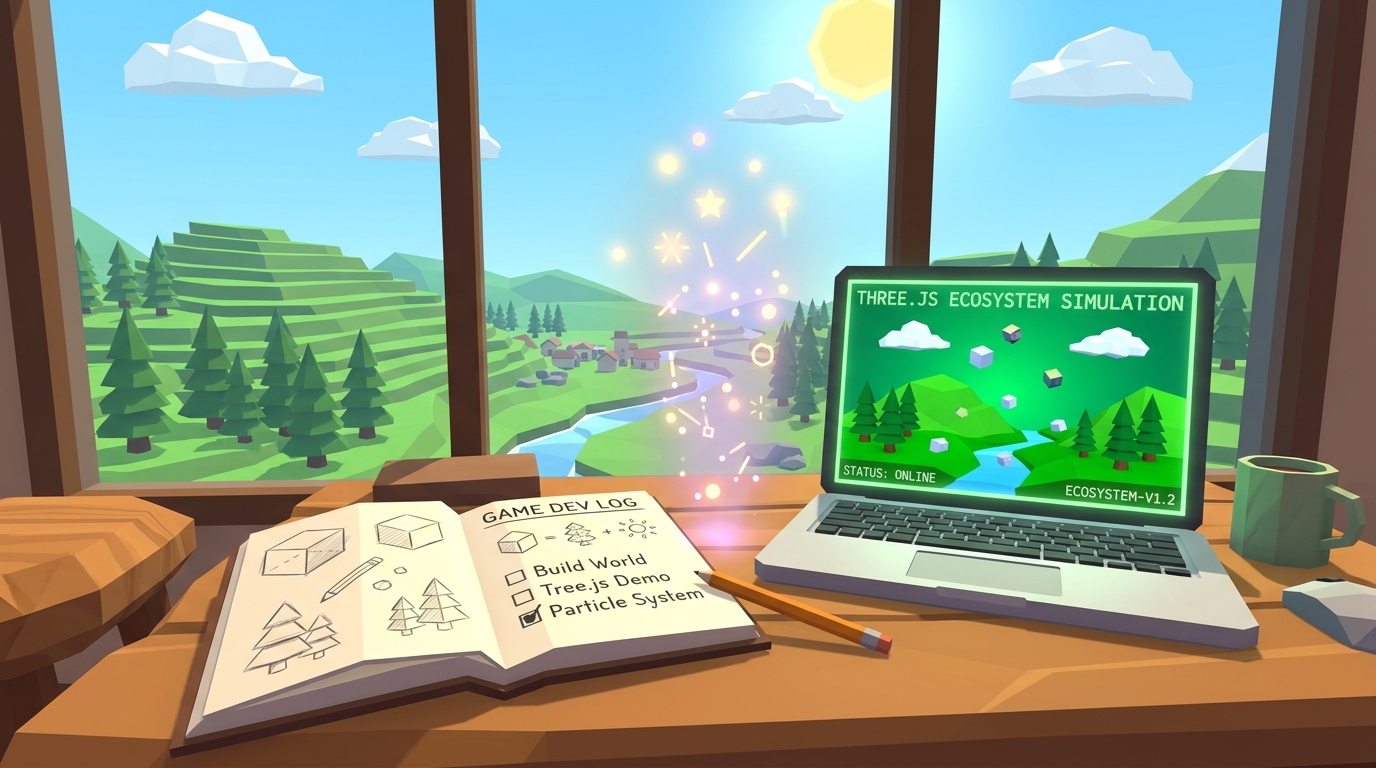
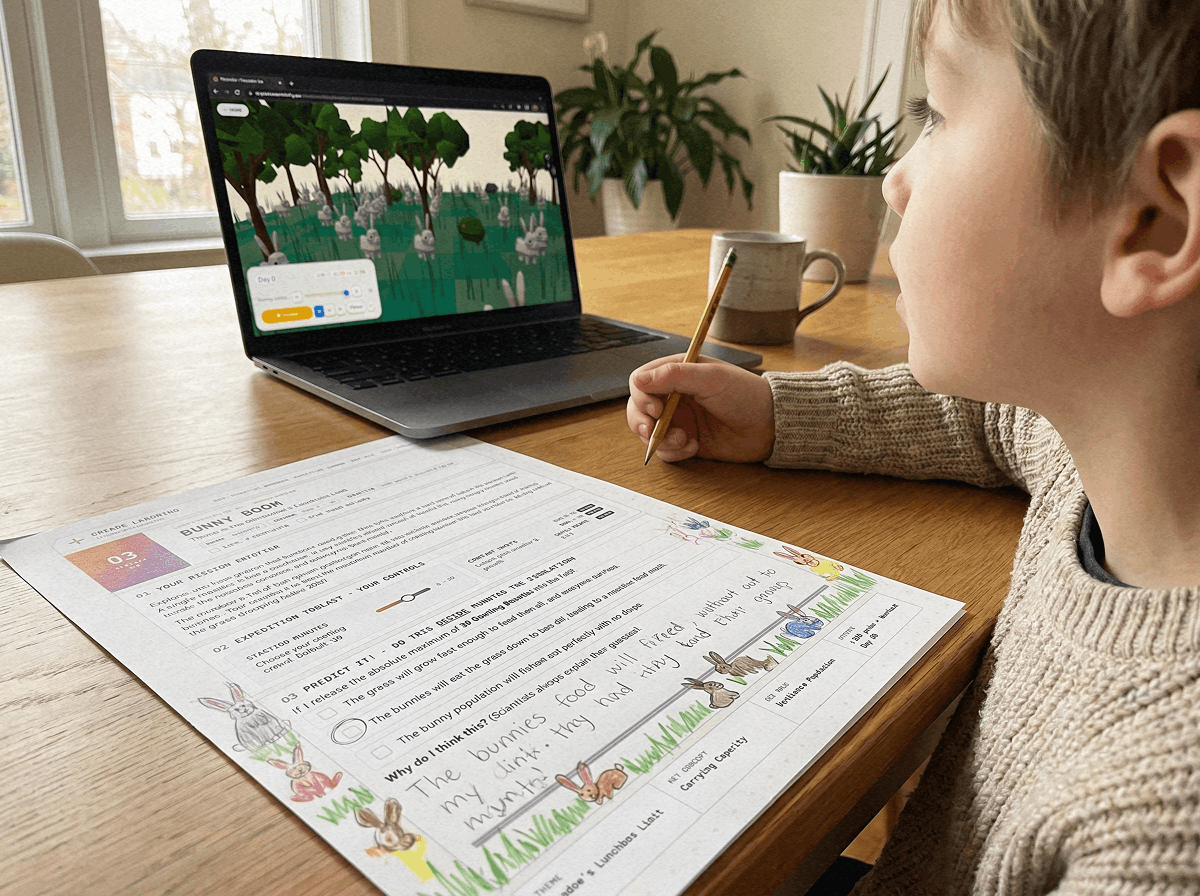
Launch the Praxos 3D Simulation Sandbox. Remove one prey species and observe whether the predators starve or adapt by consuming alternative food sources in real time.
Frequently Asked Questions About Food Webs vs. Food Chains
Answers to common student and teacher questions regarding ecological modeling.
Can an organism belong to more than one trophic level in a food web?
Why are food webs more useful than food chains for environmental conservation?
What is connectance in a food web?
Are all simulation levels and printable food web workbooks free?
Observe Living Food Web Resilience in the Praxos 3D Lab
Turn paper food web diagrams into a living, responsive scientific simulation.
Start Level 1 instantly in your browser with zero registration. Unlock all 10 simulation missions and download the complete 24-page Expedition Science Journal 100% free with email.
Step inside Level 04: The Gray Shadow to adjust predator and herbivore numbers and witness real-time ecological network stability.
START LEVEL 1 FREEExpedition Science Journal: Food Web Edition (PDF)
A 24-page hands-on student lab journal with structured inquiry prompts, energy flow mapping templates, and coordinate graphing sheets to connect paper hypothesis with 3D simulation data.