
What Is a Predator-Prey Relationship? Definition and Ecological Purpose
A predator-prey relationship is a biological interaction where a hunting organism (the predator) captures and feeds upon another living organism (the prey). While predation is often viewed dramatically as nature's conflict, ecologists recognize it as a vital regulatory mechanism that maintains community balance.
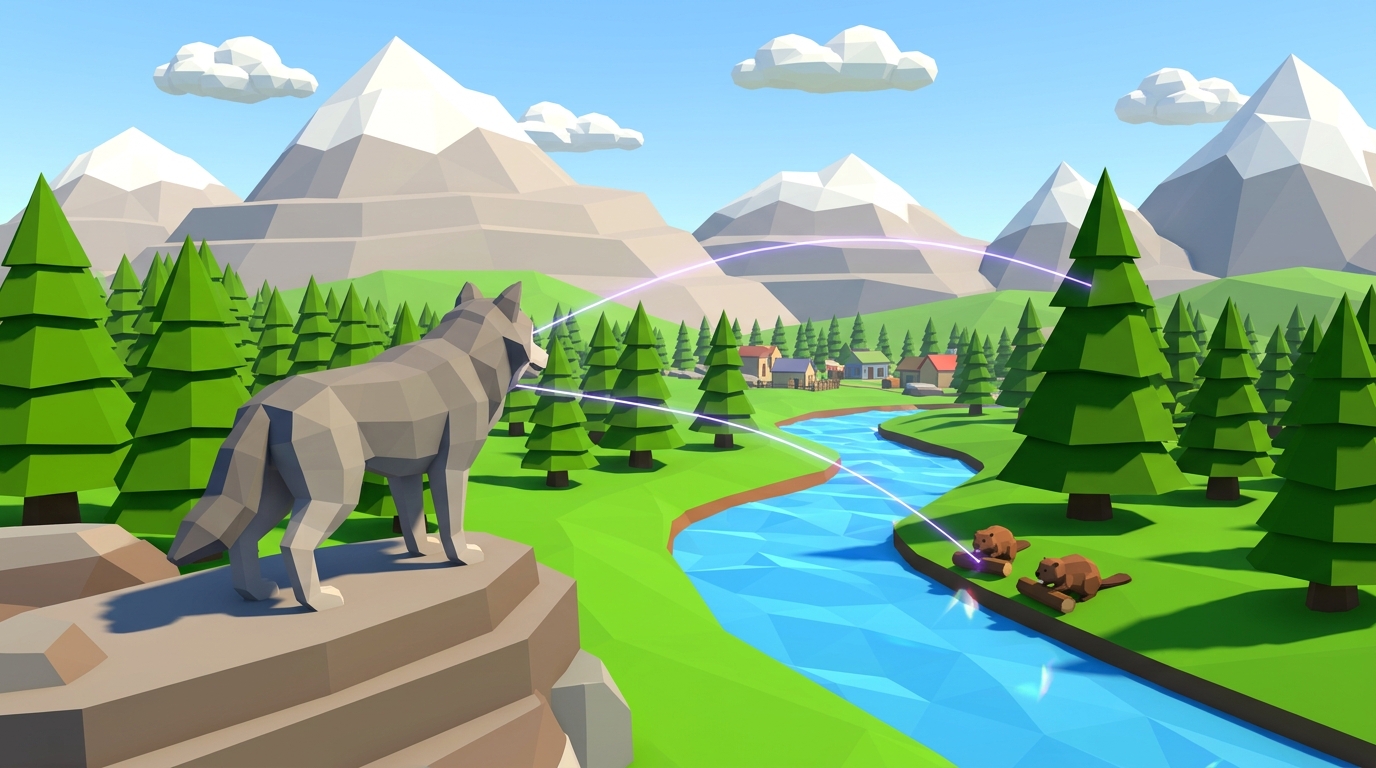
Give an example of a predator prey relationship: A classic example of a predator-prey relationship is the gray wolf and the elk in Yellowstone National Park. The wolf (predator) hunts elk (prey) for nutrition, which naturally prevents elk from overgrazing riverbanks, thereby preserving willow trees, stabilizing soil, and protecting songbird habitats.
Without predators, prey populations quickly exceed the environmental carrying capacity of their habitat, resulting in severe resource exhaustion, starvation, and widespread habitat degradation.
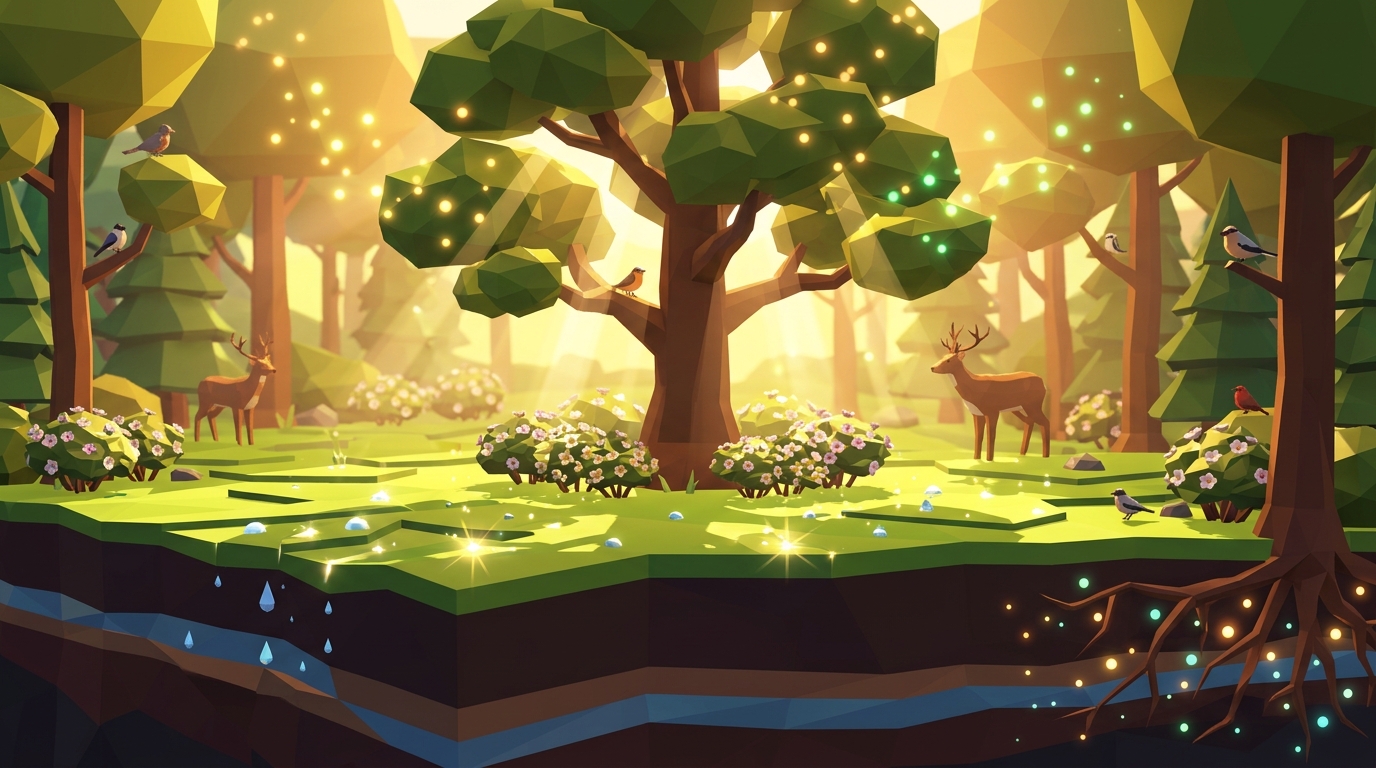
A predator-prey relationship regulates ecosystem balance: predators limit herbivore numbers, preventing overgrazing and allowing diverse plant species to flourish.
Five Real-World Predator-Prey Relationships Across Global Biomes
Predation occurs across every climate, elevation, and biome on Earth. Examining diverse habitats shows how anatomical specializations and survival strategies adapt to different environmental constraints.
| Habitat / Biome | Apex Predator | Primary Prey | Hunting Adaptation | Prey Defense Mechanism | Ecological Impact |
|---|---|---|---|---|---|
| KEYSTONE DYNAMICTemperate Forest / Valley | Gray Wolf (Canis lupus) | Rocky Mountain Elk | Cooperative pack endurance hunting | Vigilant herd grouping, sharp hooves, speed | Prevents overgrazing of riverbanks; initiates trophic cascade |
| AERIAL CARNIVOREGrassland Meadow | Red-Tailed Hawk | Eastern Cottontail Rabbit | Binocular telescopic vision, silent diving talons | Erratic zigzag sprint, freezing camouflage | Regulates small mammal populations; protects crop yields |
| MARINE APEXCoastal Marine | Great White Shark | Harbor Seal & Sea Lion | Electro-reception ampullae, ambushing vertical strike | High underwater agility, coastal haul-out rocks | Maintains coastal fish balance by weeding out sick seals |
| APEX HUNTERAfrican Savanna | Lion (Panthera leo) | Plains Zebra & Wildebeest | Stalking concealment, coordinated ambush line | Disruptive stripe camouflage, defensive kicks | Prevents savanna grasslands from turning into barren dust basins |
| MICRO PREDATORTemperate Garden / Micro | Convergent Ladybug | Plant Aphid (Pest insect) | Voracious masticating jaws (30+ aphids per day) | High reproductive speed, waxy protective secretions | Protects flowering plants and crops without toxic chemical sprays |
How Predator-Prey Population Cycles Work: The Lagged Curve
In stable ecosystems, predator and prey populations do not remain static. Instead, they oscillate in predictable mathematical rhythms first formalized by the Lotka-Volterra equations.
When prey (such as rabbits) enjoy abundant vegetation, their birth rates surge. This population spike provides an abundant food supply for predators (such as foxes or wolves). With plentiful food, predator survival rates increase and litters grow larger.
However, as the predator population expands, they consume prey faster than the prey can reproduce. Prey numbers begin to fall sharply. Faced with starvation, the predator population inevitably declines several generational cycles later (the classic predator lag). With hunting pressure relieved, surviving prey begin multiplying again, restarting the cycle.
Predator population curves always lag behind prey population curves. A prey boom triggers a subsequent predator boom, while a prey crash forces a delayed predator crash.
What Happens When Top Predators Vanish: The Trophic Cascade Threat
When human activity or habitat fragmentation removes an apex predator, the entire food web destabilizes in a process known as a trophic cascade.
In the absence of natural predators, herbivores multiply unchecked. In Yellowstone, when gray wolves were eradicated in the early 20th century, elk populations exploded. Elk browsed young cottonwood and willow shoots down to the bare dirt along stream banks.
Without tree roots to anchor riverbeds, streams eroded and widened. Beavers, who rely on willow trees to construct dams, abandoned the waterways, which subsequently dried out cold-water trout pools. When wolves were reintroduced in 1995, elk were kept moving, willow groves recovered, beavers returned, and songbird species rebounded.
Investigating Predator-Prey Dynamics: A 3-Stage Student Lab
In classroom and homeschool settings, educators use these three practical investigation stages to build quantitative intuition:
Establish Baseline Carrying Capacity on Paper
Calculate the maximum number of rabbits a meadow can sustain given 500 units of daily forage grass. Record this number in the student lab journal.
Simulate a Single Predator Introduction in 3D
Launch the Praxos 3D Simulation Sandbox. Introduce a single wolf pair into an overcrowded rabbit meadow and observe the initial steep drop in herbivore numbers.
Graph Coupled Oscillations Across Ten Generations
Track population counts at regular time increments and plot both curves on coordinate axes to observe the characteristic phase lag between predator and prey.
Frequently Asked Questions About Predator-Prey Biology
Answers to common student, parent, and teacher questions regarding ecological predation.
Are predators harmful to their prey species as a whole?
What is the difference between a predator and a parasite?
Can herbivores ever become predators?
Are all simulation levels and printable journals completely free?
Test Predator-Prey Balance in the Praxos 3D Lab
Bring mathematical population curves to life with interactive 3D simulation.
Start Level 1 instantly in your browser with zero registration. Unlock all 10 simulation missions and download the complete 24-page Expedition Science Journal 100% free with email.
Step into Level 03: Bunny Boom and Level 04: The Gray Shadow to adjust predator and prey densities in real time.
START LEVEL 1 FREEPredator-Prey Data Graphing Log (PDF)
A 24-page hands-on student lab journal with coordinate graphing worksheets, Lotka-Volterra oscillation analysis templates, and ecosystem health checklists.