
What Is an Aquatic Food Web? Understanding Life in the Photic Zone
An aquatic food web represents the complex feeding connections across a body of water, ranging from quiet backyard freshwater ponds to the vast open ocean. While terrestrial food chains start with rooted grasses and tall trees, aquatic ecosystems depend almost entirely on floating microscopic organisms.
At the foundation of every aquatic food web are phytoplankton: single-celled photosynthetic organisms that harness sunlight in the upper sunlit layer of water, known as the photic zone. These microscopic algae generate over half of the oxygen in Earth's atmosphere and convert solar radiation into chemical energy.
Because energy must flow upward through microscopic primary consumers before reaching visible fish, aquatic food webs often feature more trophic tiers than land-based systems. Understanding these connections helps students grasp why water clarity, temperature, and sunlight directly govern marine biodiversity.
Phytoplankton are the invisible engine of aquatic life. Without adequate sunlight and dissolved mineral nutrients in the upper water column, entire multi-tier marine food webs collapse from the bottom up.
Two Classic Aquatic Food Webs: Freshwater Pond vs. Open Ocean
To help students visualize aquatic feeding relationships, comparing a shallow freshwater pond with an open ocean biome provides a practical framework. Both follow identical thermodynamic laws, but feature organisms adapted to drastically different water depths and chemistry.
In a freshwater pond, rooted plants like water lilies and cattails work alongside floating green algae to capture sunlight. In the open ocean, rooted plants cannot survive the deep water, so free-floating phytoplankton (diatoms and dinoflagellates) form the sole primary producer tier.
Here is how energy flows through each system across trophic levels:
| Trophic Level | Freshwater Pond Example | Open Ocean Biome Example | Ecological Role |
|---|---|---|---|
| SOLAR CONVERTERSPrimary Producers | Microscopic green algae, duckweed, water lilies | Phytoplankton (diatoms, dinoflagellates, cyanobacteria) | Harness solar radiation via photosynthesis; base of biomass |
| HERBIVORESPrimary Consumers | Zooplankton (Daphnia, rotifers), pond snails, mosquito larvae | Zooplankton (copepods, krill, larval mollusks) | Filter-feed on producers; convert plant matter into animal biomass |
| SMALL CARNIVORESSecondary Consumers | Minnows, water beetles, tadpoles, small bluegill | Small schooling forage fish (herring, anchovies, sardines) | Feed on zooplankton; primary prey source for larger predators |
| MID PREDATORSTertiary Consumers | Yellow perch, bullfrogs, garter snakes | Mid-tier predators (mackerel, squid, juvenile tuna) | Hunt smaller fish; transfer concentrated energy up the web |
| APEX HUNTERSApex Predators | Northern pike, largemouth bass, great blue heron | Great white shark, orca, adult bluefin tuna | Top of the aquatic food web; regulate lower population tiers |
| NUTRIENT RECYCLERSDecomposers & Benthos | Tubifex worms, freshwater bacteria, crayfish | Deep-sea bacteria, benthic crabs, sea cucumbers | Recycle organic detritus into bioavailable nitrates and phosphates |
Following the Energy Arrows: The 10% Ecological Law in Water
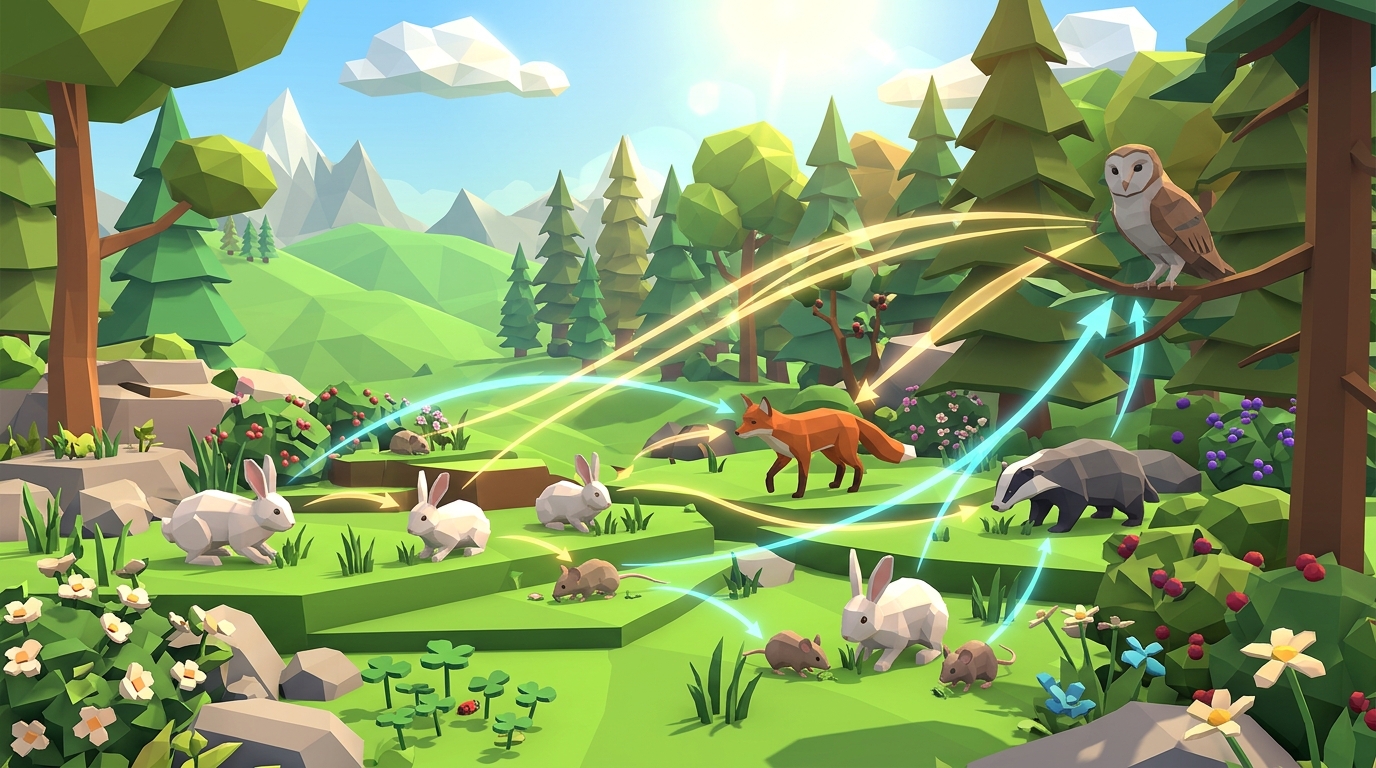
A frequent error students make when drawing aquatic food webs is reversing the direction of the arrows. In scientific modeling, arrows in an aquatic food web point from the organism being consumed toward the consumer that eats it. The arrow represents the physical transfer of biomass and metabolic energy.
For example, an arrow points from phytoplankton to zooplankton, and another arrow points from zooplankton to minnows. Tracing an arrow is equivalent to asking: "Where does this organism's energy travel next?"
Furthermore, aquatic food webs obey Lindeman's 10% Rule. Because organisms expend roughly 90% of their ingested energy on metabolic respiration, swimming, and heat loss, only about 10% of energy is stored as body tissue for the next trophic level. Consequently, an ocean ecosystem requires 10,000 kilograms of phytoplankton to support 1,000 kilograms of krill, 100 kilograms of herring, 10 kilograms of tuna, and just 1 kilogram of shark.
Arrows point from food into the mouth that eats it. They track energy flow, not hunting behavior. Phytoplankton -> Zooplankton -> Minnow -> Pike.
How an Aquatic Food Web Differs from a Simple Marine Food Chain
A simple marine food chain presents a single linear path: phytoplankton -> copepod -> herring -> harbor seal -> orca. While useful for introducing basic trophic concepts, real aquatic systems are never linear.
In reality, herring do not eat only copepods; they also consume larval crabs and small mollusks. In turn, herring are eaten by cod, salmon, squid, seabirds, and seals. If one food source becomes scarce, consumers switch to alternative prey.
This web of alternate feeding pathways provides ecological buffering. In a rigid food chain, removing copepods would instantly starve herring. In an authentic aquatic food web, herring temporarily shift their foraging toward alternative zooplankton species, dampening the shockwave across the ecosystem.
Hands-On Disruption Scenarios: What Happens When Water Systems Shift?
To build systems thinking skills, students should explore what occurs when variables in an aquatic food web change. In classroom trials and homeschool investigations, three disruption scenarios produce powerful "aha" moments:
The Algal Bloom & Oxygen Depletion Scenario
Introduce excessive agricultural runoff (nitrogen and phosphorus) into a pond. Phytoplankton explodes rapidly, blocking sunlight from reaching submerged plants. When the algae dies, decomposing bacteria consume all dissolved oxygen, suffocating fish.
The Apex Predator Removal Experiment
Simulate overfishing by eliminating northern pike from the pond or sharks from the reef. Without apex predation, mid-level carnivores overpopulate, decimating small forage fish and allowing zooplankton to crash.
The Temperature and Water Level Stress Test
Simulate summer drought by reducing water volume and raising temperature. Warmer water holds less dissolved oxygen, directly capping carrying capacity across all consumer tiers.
Frequently Asked Questions About Aquatic Food Webs
Clear answers to questions frequently asked by science educators, students, and homeschool parents.
What is the primary difference between a pond and an ocean food web?
Why do aquatic food webs often have more trophic levels than land food webs?
How do decomposers fit into an aquatic food web?
Are all simulation levels and printable aquatic journals free?
Simulate Aquatic Trophic Networks in the Praxos 3D Lab
Move beyond static diagrams by testing living aquatic and terrestrial food webs in real time.
Start Level 1 instantly in your browser with zero registration. Unlock all 10 simulation missions and download the complete 24-page Expedition Science Journal 100% free with email.
Adjust sunlight, model predator-prey feedback loops, and graph multi-generation population balance in our browser sandbox.
START LEVEL 1 FREEAquatic Ecosystem Observation Sheet (PDF)
Download our complete 24-page Expedition Science Journal with dedicated freshwater and marine food web mapping diagrams, energy arrow worksheets, and data tables.