What Is Carrying Capacity in Ecology?
In ecological biology, carrying capacity (denoted by the variable K) represents the maximum number of individuals of a given species that an environment can sustain indefinitely without degrading its natural resource base.
Carrying capacity is not a static number carved into stone; it is a dynamic ceiling determined by the interplay between abiotic energy inputs (sunlight, rainfall, soil minerals) and biotic relationships (food availability, competition, disease, and predation). When environmental conditions improve, carrying capacity expands; when drought or habitat loss occurs, carrying capacity contracts.
What Happens When a Population Nears Carrying Capacity?
When a population approaches its environmental carrying capacity, resources per individual become scarce, causing birth rates to decline and mortality rates to rise. Depending on the speed of growth and the resilience of the ecosystem, one of three biological outcomes occurs:
Outcome 1: Logistic S-Curve Stabilization. In a stable environment with gradual growth, population growth slows as it nears K, leveling off smoothly into an S-shaped logistic curve.
Outcome 2: Dynamic Wave Oscillations. In ecosystems with predator-prey dynamics, populations naturally oscillate in rhythmic cycles above and below carrying capacity, continually adjusting to resource replenishment.
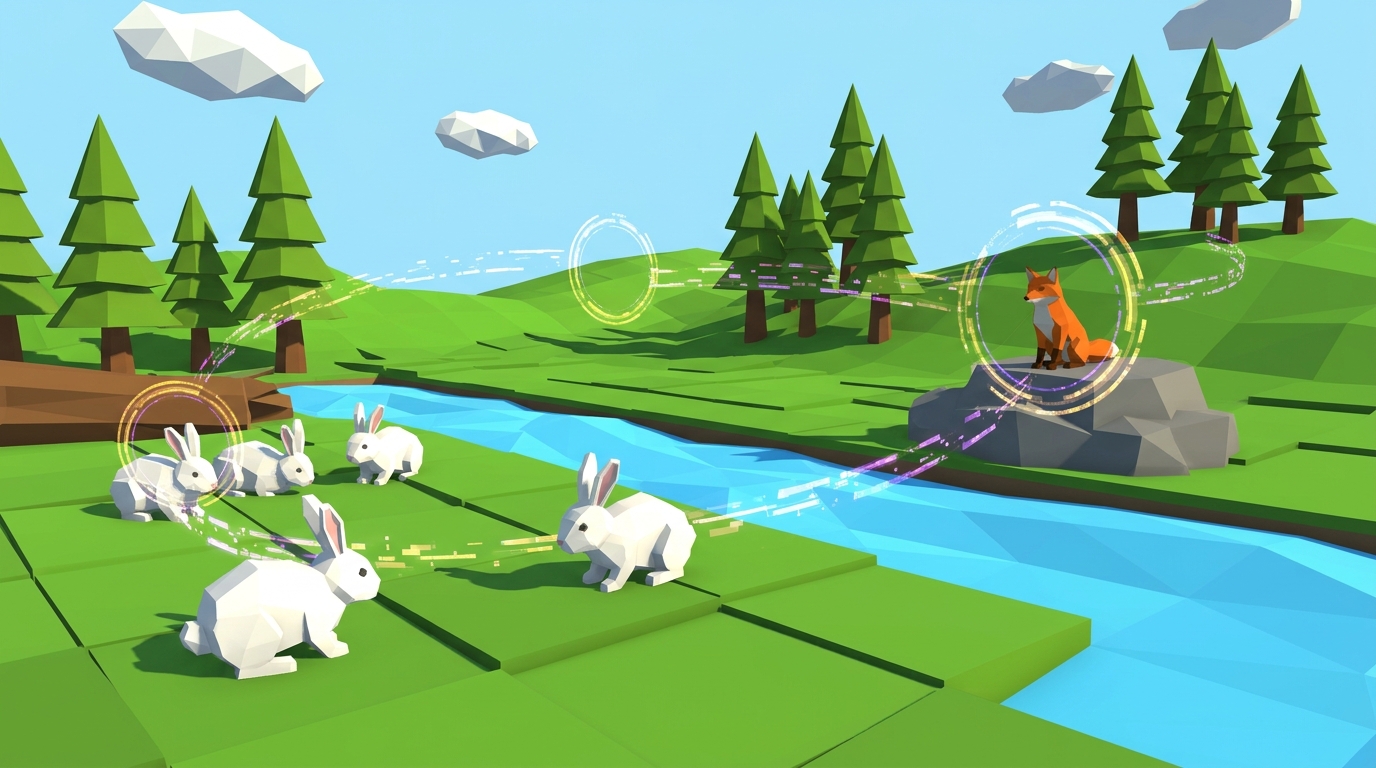
Outcome 3: Severe Overshoot and Malthusian Collapse. If a population multiplies too quickly, it exceeds K before feedback mechanisms take effect. Herbivores overgraze the vegetation, destroying the habitat regenerative capacity and triggering a catastrophic population crash as modeled in natural selection simulations.
Populations do not simply halt at carrying capacity; they stabilize, oscillate in rhythmic waves, or overshoot and suffer severe crashes.
The Carrying Capacity Formula Explained in Plain English
In high school and college biology, logistic population growth is described by the differential equation: dN/dt = rN * ((K - N) / K). While the math looks intimidating at first glance, its conceptual logic is straightforward:
N: Current population size.
r: Maximum intrinsic growth rate per individual.
K: Environmental carrying capacity ceiling.
(K - N) / K: The fraction of carrying capacity still available for future growth.
When N is very small compared to K, the term (K - N) / K is nearly 1, meaning the population grows rapidly (exponential phase). As N approaches K, (K - N) / K shrinks toward 0, applying biological brakes that slow population growth to a halt.
Density-Dependent vs. Density-Independent Limiting Factors
Environmental factors that regulate population size near carrying capacity fall into two distinct scientific categories:
| Factor Type | Definition | Key Examples | Impact on Carrying Capacity |
|---|---|---|---|
| Density-Dependent | Factors whose intensity increases as population density rises | Food scarcity, disease transmission, waste accumulation, predation | Directly creates the logistic carrying capacity ceiling (K) |
| Density-Independent | Environmental stressors that affect populations regardless of density | Wildfires, flash floods, severe freezes, volcanic eruptions | Abruptly reduces population size independent of current density |
Model Carrying Capacity in a Free 3D Laboratory
Instead of merely calculating K on paper, students can observe carrying capacity dynamics in action using Praxos Ecosystem. Learn how to teach carrying capacity and food webs through hands-on modeling with abiotic and biotic controls.
All 10 simulation levels and the 24-page printable Expedition Science Journal are 100% free with email. Level 1 starts instantly in your web browser with zero setup.
Experiment with population growth, overshoot, and carrying capacity balance in our free browser sandbox.
LAUNCH SIMULATION LABCarrying Capacity Graphing Worksheet
Includes logistic growth graphing grids, limiting factor analysis sheets, and dinner roundtable discussion prompts.