
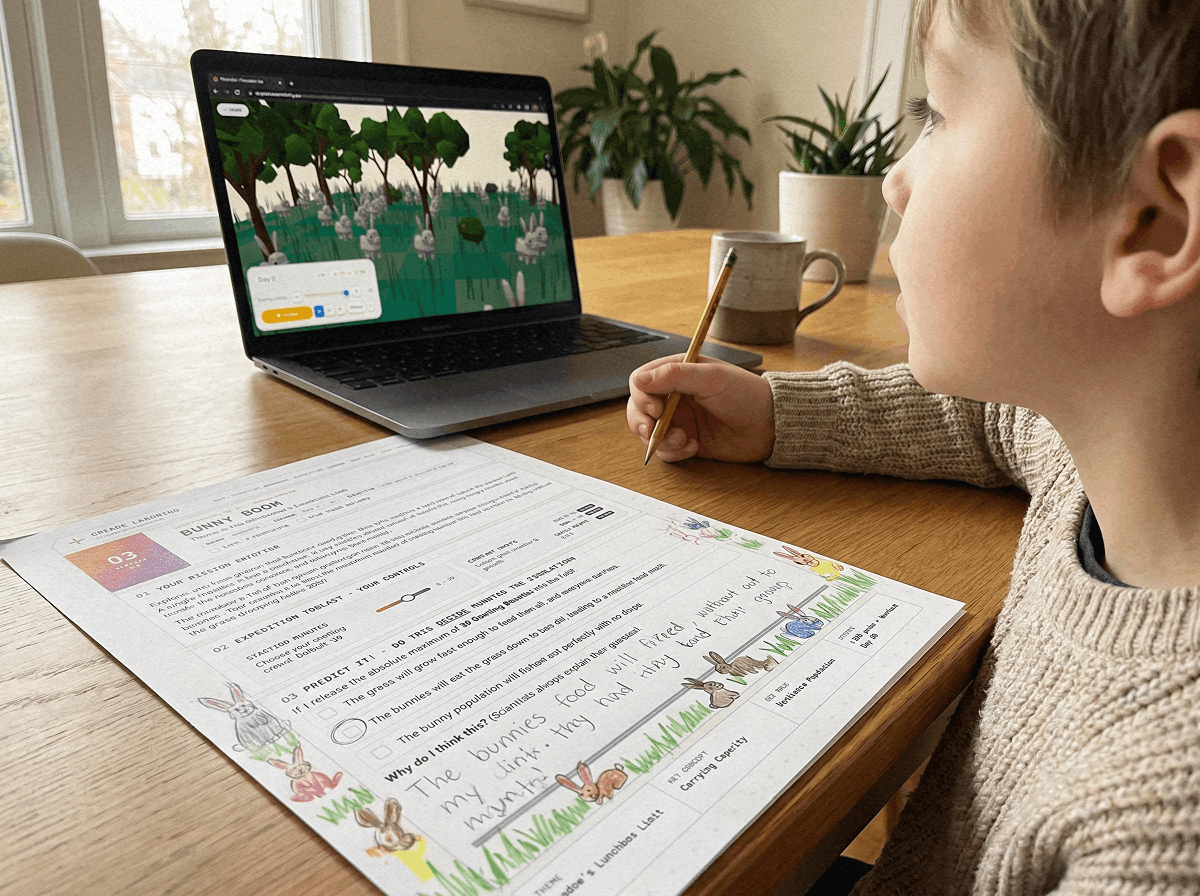
The Lunchbox Metaphor: Making Ecological Limits Obvious
If you attempt to explain carrying capacity using complex mathematical differential equations, young students quickly tune out. But when you use the Lunchbox Metaphor, the fundamental principle clicks immediately: imagine packing a lunchbox with 4 sandwiches for a picnic, but 20 hungry friends show up to eat them.
In nature, a grassy meadow functions just like that lunchbox (see our in-depth article on carrying capacity explained). If you place 50 bunnies on a field with slow-growing vegetation, they will consume every available blade of grass in two weeks. With zero nutrition remaining, the entire population suffers a severe collapse. Seeing this unfold in an interactive 3D simulation generates an unforgettable "Aha!" moment.
Carrying capacity represents the maximum population size of a species that a specific environment can sustainably support without degrading the underlying resource base.
Why Predators Are Essential Guardians of the Meadow
In children's storybooks and animated cartoons, wolves and foxes are almost always cast as the villains. However, in authentic ecological science, predators are indispensable stewards of biodiversity.
By keeping herbivore numbers balanced, predators prevent rabbits and deer from stripping plants down to bare topsoil. When apex predators are healthy, trees flourish and rivers stabilize, as demonstrated by the wolves in Yellowstone.
In Level 4: The Gray Shadow, kids introduce wolves to balance rabbit herds and protect the meadow vegetation.
PLAY LEVEL 4 LABClassroom & Homeschool Activity: Graphing the S-Curve vs J-Curve
Have your student draw two distinct curves on coordinate grid paper:
1. The J-Curve (Exponential Growth): Illustrating rapid, unchecked population expansion that abruptly crashes into resource starvation.
2. The S-Curve (Logistic Growth): Demonstrating how natural balancing factors smooth population numbers into steady carrying capacity equilibrium.
The Meadow Lunchbox Lab
Start with Level 1 instantly in your browser (no sign-up needed). Unlocking the full lab with your email lets your child test Level 3: release 50 rabbits, observe the grass disappear, and discover the exact carrying capacity.
NGSS Curricular Standard Alignment: MS-LS2-1
This dual-format exercise directly fulfills Next Generation Science Standard MS-LS2-1: "Analyze and interpret data to provide evidence for the effects of resource availability on organisms and populations in an ecosystem."
Classroom Inquiry Guide: Managing the 3 Phases of Food Web Exploration
Teaching carrying capacity and trophic relationships under NGSS standards (MS-LS2-1 and MS-LS2-2) requires moving students through three structured pedagogical phases: Baseline Equilibrium, Perturbation Testing, and System Restoration.
Phase 1 (Baseline Equilibrium): Students configure a simple two-tier ecosystem (producers and primary consumers) and observe carrying capacity as an S-curve leveling off due to resource constraints. Phase 2 (Perturbation Testing): Students introduce environmental stress (such as severe drought or an invasive competitor) and chart the resulting population crash. Phase 3 (System Restoration): Students design biological management interventions (such as reintroducing a keystone predator) to stabilize the trophic cascade.
Throughout all three phases, require students to cite quantitative evidence from their simulation trials to support their causal claims during peer presentations.
NGSS Performance Expectation Alignment (MS-LS2-1 & MS-LS2-2) Checklist
Ensure your lesson plan fulfills every dimension of Next Generation Science Standards with this practical educator checklist:
Science & Engineering Practice: Developing and Using Models (Students manipulate digital simulation parameters and construct handwritten system diagrams to predict ecological outcomes). Disciplinary Core Idea: LS2.A Interdependent Relationships (Students demonstrate how food, water, and shelter limit population size). Crosscutting Concept: Cause and Effect (Students identify non-linear relationships and delayed feedback mechanisms in trophic networks).
By explicitly linking student simulation data to these three dimensions, educators ensure rigorous standards compliance while keeping student engagement exceptionally high.
Mission Log 3: Carrying Capacity Student Worksheet
Printable trial log sheet designed to be filled out hand in hand with Level 3, featuring prediction checklists, data tables, and sketch zones.