Why Static Food Web Worksheets Fall Short in Science Class
For decades, standard biology curricula relied on static arrows drawn on paper worksheets to teach food webs. Students labeled producers at the bottom, drew arrows pointing toward herbivores, and capped the diagram with an apex predator. While this exercise reinforces basic trophic vocabulary, it fails to build genuine scientific intuition about how ecosystems function in the physical world.
In nature, an ecosystem is not a static drawing; it is a non-linear dynamical system. When a drought strikes a meadow, grass biomass does not simply drop instantly to zero. Plant growth decelerates, herbivore reproduction rates decline after a delayed gestation window, and predators face starvation weeks later. Static worksheets cannot depict these time-delayed biological feedback loops.
An interactive food web activity bridges this cognitive gap by placing students inside a living model. By manipulating species populations and observing simulated consequences over 100 virtual days, students experience the dynamic stability of real trophic networks.
Science understanding grows from observing systems respond to disturbance. An interactive food web transforms passive memorization into active scientific inquiry.
The 4-Stage Classroom Inquiry Routine (45-Minute Lesson Plan)
To ensure that students do not treat an interactive food web like an unguided video game, we recommend pairing the digital simulation with our structured 4-stage inquiry routine:
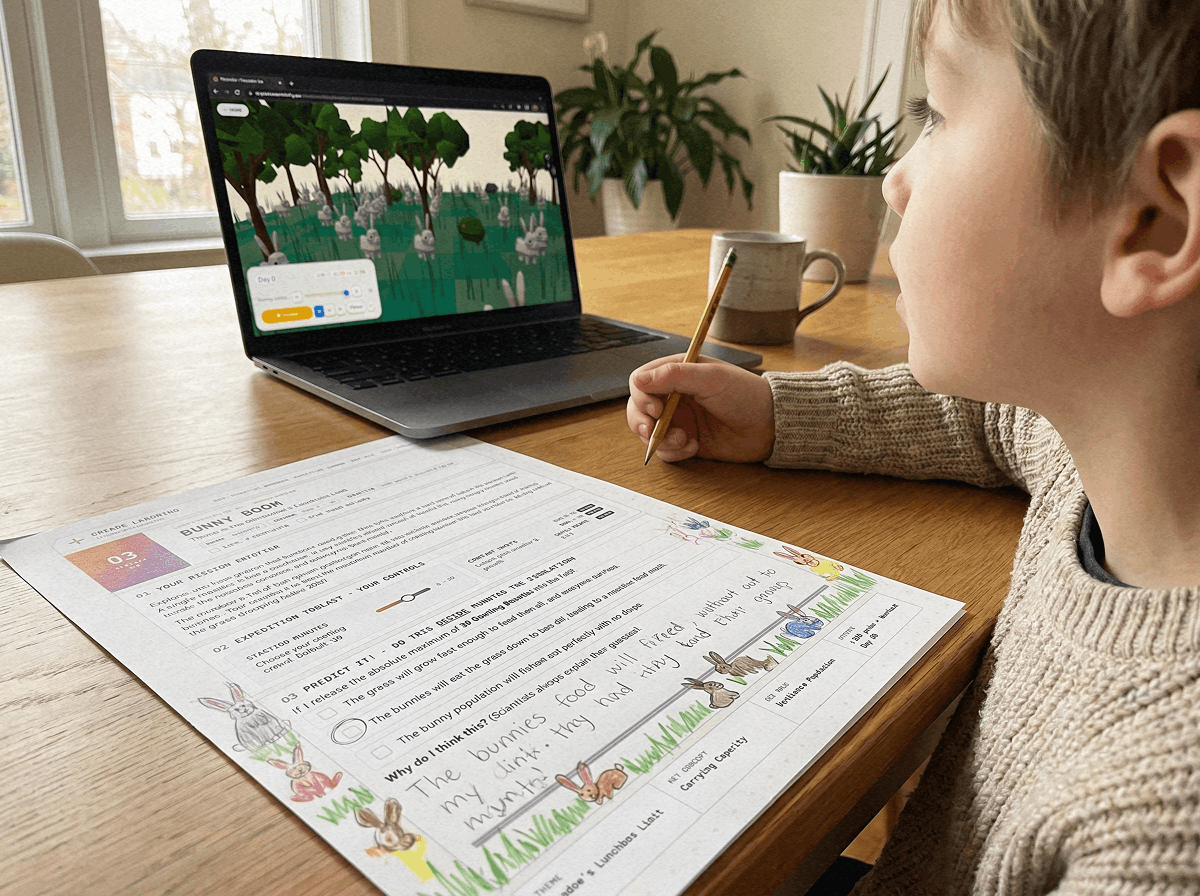
PREDICT (Individual Journaling, 7 Minutes)
Before touching any simulation controls, students record a formal hypothesis in their printable science journal: "If we double the primary consumer population, then producer biomass will decrease by at least 40% within 20 simulation days."
SIMULATE (Live 3D WebGL Trial, 15 Minutes)
Students open the browser sandbox and execute their trial. They adjust environmental sliders, run the clock forward, and observe how plant growth and predation rates interact.
GRAPH (Data Visualization, 13 Minutes)
Students transfer real-time population numbers from the simulation readout onto paper coordinate grids, drawing multi-line graphs showing predator-prey population oscillations.
REFLECT (Classroom Synthesis, 10 Minutes)
Students present their findings to lab partners, discussing whether their data supported their hypothesis and identifying unanticipated ecological feedback loops.
Key Experiments to Run in an Interactive Food Web
Here are three high-yield laboratory experiments you can run with your students using the Praxos interactive 3D simulation sandbox:
Experiment 1: The Abiotic Drought Shock. Instruct students to reduce sunlight and rainfall sliders by 60% while holding animal numbers constant. Students observe how quickly primary producer carrying capacity drops and track which consumer tier experiences mortality first.
Experiment 2: Apex Predator Addition. Students introduce a pack of secondary consumers into an overpopulated herbivore pasture. Students measure the trophic cascade: as predation controls herbivore overgrazing, native plant cover regenerates across meadow tiles.
Experiment 3: Keystone Species Removal. Students selectively remove keystone burrowers or primary consumers to observe competitive exclusion and habitat degradation across the wider food web.
Static Food Web Puzzles vs. Dynamic 3D Simulations
Not all digital food web tools are created equal. When evaluating interactive websites for your curriculum, understand how different formats support student learning:
| Feature | Drag-and-Drop Arrow Puzzles | Dynamic 3D WebGL Sandboxes (Praxos) |
|---|---|---|
| NGSS ALIGNEDScientific Depth | Tests rote recall of who eats whom | Models real-time differential population equations |
| Variable Manipulation | Fixed linear arrows; zero variable control | Adjustable sunlight, moisture, herbivore quotas, predator density |
| Feedback Loops | Binary pass/fail validation | Emergent population booms, crashes, and carrying capacity oscillations |
| Student Agency | Single predetermined correct answer | Open-ended scientific experimentation with multiple stable solutions |
| Curriculum Artifacts | Digital badge or score screen | 24-page printable companion lab logbook with graphing exercises |
Frequently Asked Questions About Interactive Food Web Activities
Answers to common educator questions regarding digital food web lab implementation in middle school classrooms:
What grade level is best suited for an interactive food web activity?
Do students need user accounts or software installations to play?
How do interactive food webs connect to the 10 percent rule of energy transfer?
Can this activity be used for homeschool science units?
Free Supporting Science Curriculum and Classroom Tools
Enhance your classroom ecology unit with these related educational guides:
Discover top educational titles in our best free food web games online catalog.
Explore sandbox mechanics in our food web simulation online guide.
Find classic ecosystem challenges in our feed the dingo game alternatives review.
Compare virtual biology labs in our food web simulation phet alternative guide.
Set up your teacher account and class roster on our educator dashboard.
Printable energy pyramid calculation tables, trophic level matching sheets, and hypothesis logs designed for all 10 simulation missions.
GET FREE MISSION LOGBOOK (PDF)24-Page Expedition Science Journal
A printable lab notebook featuring hypothesis sheets, food web energy transfer calculation charts, and population graphing grids for classroom labs.