Decoding the Prairie Food Web Diagram: The Cardinal Rule of Energy Arrows
In life science education, food webs are among the most frequently tested concepts across state and national standards (including NGSS MS-LS2-3 and 5-LS2-1). Yet biology teachers consistently report that up to 40% of middle school students misunderstand what food web diagrams represent.
The most widespread misconception is reversing arrow directions. Students intuitively draw arrows from predators pointing toward prey (for example, from a hawk pointing toward a prairie dog) thinking the arrow signifies attacking or eating. In scientific diagrams, however, the arrow represents the transfer of biological energy and nutrients: it always points from the organism eaten to the consumer who absorbs that energy.
To build a firm foundation before analyzing complex diagrams, review the overarching trophic layers in our prairie food chain guide.
The arrow ALWAYS points into the mouth of the consumer: Producer -> Primary Consumer -> Secondary Consumer -> Apex Predator.
Architecture of a Temperate Grassland Food Web
Unlike simplified linear food chains, a natural prairie food web features dozens of overlapping feeding relationships. Energy originates with the sun and flows through four primary biological compartments:
1. Primary Producers (Autotrophs): Native perennial grasses (big bluestem, blue grama, switchgrass) and prairie forbs (purple coneflower, prairie blazing star, sunflower) use chlorophyll to fix carbon into high-energy sugars.
2. Primary Consumers (Herbivores): Multiple herbivore guilds coexist by dividing food resources. While bison and pronghorn feed on above-ground stems, prairie dogs clip surface foliage and unearth seeds, and gophers feed on deep root tubers. Explore these animals in our grassland primary consumers guide.
3. Secondary Consumers (Omnivores and Small Predators): Plains garter snakes, western meadowlarks, tiger salamanders, and grasshopper mice feed on herbivorous insects and small rodents, regulating mid-level energy flows.
4. Tertiary and Apex Predators: Red-tailed hawks, coyotes, American badgers, and black-footed ferrets hunt both primary and secondary consumers. See how energy constrains apex predators in our red-tailed hawk trophic level guide.
Prairie Food Web Organisms and Trophic Mapping Matrix
Use this reference matrix to construct or analyze a multi-branched Great Plains food web diagram in your classroom:
| Organism | Trophic Category | Receives Energy From | Delivers Energy To |
|---|---|---|---|
| Big Bluestem Grass | Primary Producer | Sunlight, Soil Nutrients, Water | Grasshoppers, Prairie Dogs, Bison |
| Purple Coneflower | Primary Producer | Sunlight, Soil Nutrients, Water | Native Bees, Butterflies, Seed-Eating Birds |
| Differential Grasshopper | Primary Consumer | Big Bluestem, Prairie Forbs | Meadowlarks, Garter Snakes, Spiders |
| Black-Tailed Prairie Dog | Primary Consumer (Keystone) | Grass Stems, Roots, Seeds | Ferrets, Badgers, Coyotes, Hawks |
| Western Meadowlark | Secondary Consumer | Grasshoppers, Crickets, Beetles | Red-Tailed Hawks, Prairie Falcons |
| Plains Garter Snake | Secondary Consumer | Grasshoppers, Salamanders, Mice | Hawks, Coyotes, Badgers |
| Black-Footed Ferret | Tertiary Carnivore | Prairie Dogs (over 90% diet) | Coyotes, Owls, Decomposers |
| Red-Tailed Hawk | Apex Raptor Predator | Prairie Dogs, Snakes, Meadowlarks | Decomposers (upon natural mortality) |
A 45-Minute NGSS Classroom Lab Plan: Modeling Grassland Webs in 3D
Transform your life science unit from a static worksheet session into an active student investigation using this classroom lab sequence:
Phase 1: Engage (5 Minutes): Present the opening question: "Why do food web arrows point toward the animal eating rather than the animal being eaten?" Have students write down their reasoning in their lab journals.
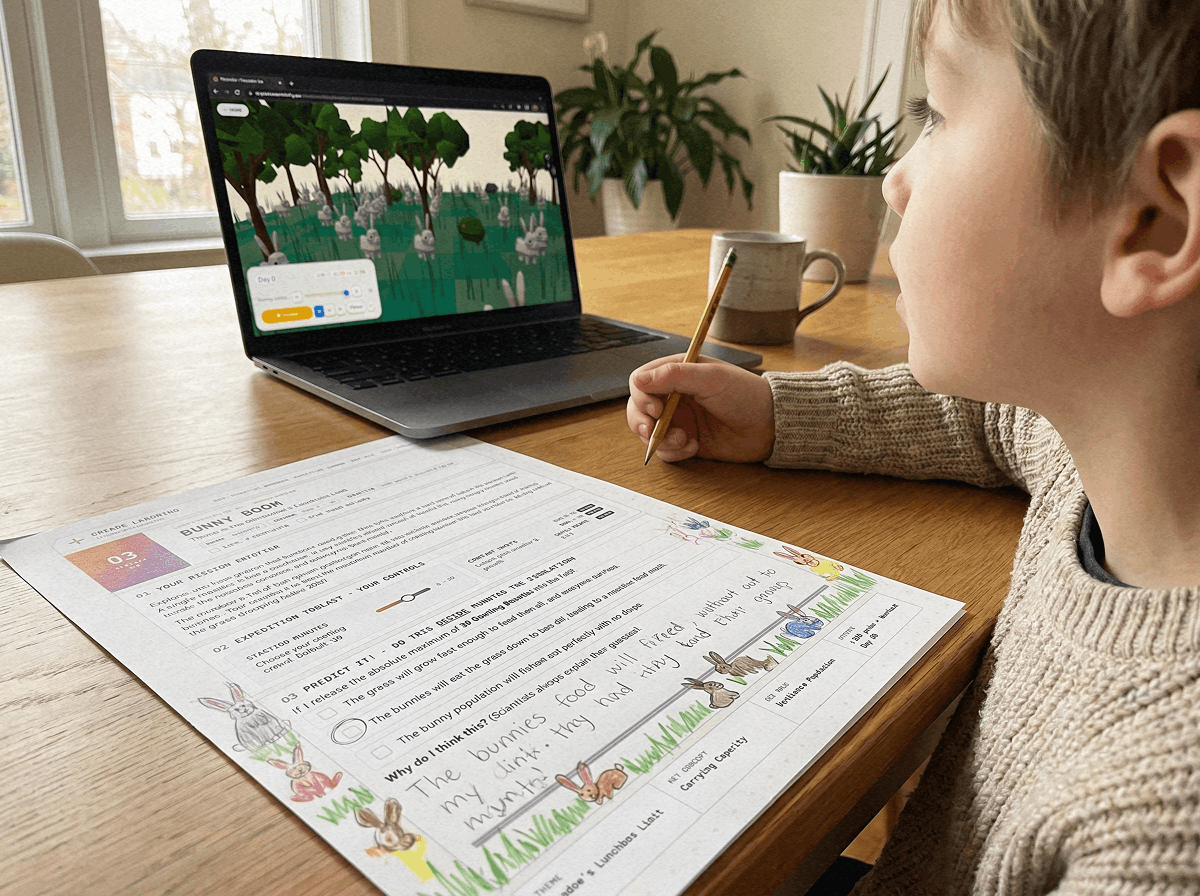
Phase 2: Explore via 3D Simulation (20 Minutes): Have students open the Praxos 3D Simulation on their Chromebooks, tablets, or laptops. Direct them to Levels 1 through 3 to model plant growth and herbivore foraging in real time. Have students sketch out the food web they are interacting with on screen.
Phase 3: Explain and Diagram (10 Minutes): Direct students to connect their digital observations into a formal food web diagram, drawing accurate energy arrows between native grasses, burrowing herbivores, and predators.
Phase 4: Elaborate and Synthesize (10 Minutes): Pose an ecological disturbance scenario: "What happens if a severe drought cuts plant growth by 70%?" Students adjust the abiotic moisture sliders in the simulator to verify their predictions and record results.
Develop a model to describe the cycling of matter and flow of energy among living and nonliving parts of an ecosystem.
Common Student Misconceptions in Prairie Food Web Diagrams
When evaluating student food web diagrams, watch for these three frequent conceptual errors:
Misconception 1: "Top Predators Eat Everything Below Them." Students often draw lines connecting apex predators directly to grass, assuming higher-level carnivores eat all lower tiers. Clarify that red-tailed hawks and coyotes lack the digestive enzymes to obtain calories from grass.
Misconception 2: "Decomposers Are Excluded from the Web." Many textbook diagrams omit soil microbes and fungi, leaving students with the impression that dead matter simply vanishes. In reality, decomposers recycle nitrogen and minerals back into the soil for producers to absorb.
Misconception 3: "Food Webs Are Linear." Students often treat food webs as separate food chains drawn on the same paper. Highlight organisms with multiple feeding branches (like coyotes hunting both grasshoppers and prairie dogs) to show ecological redundancy.
Simulating Dynamic Prairie Food Webs in Real Time
In physical ecosystems, food web interactions change constantly based on seasonal shifts, population densities, and predator presence. The Praxos 3D Ecosystem Simulation lets students observe these dynamic feedbacks in action.
Instead of viewing static line drawings on a page, students watch virtual herbivores forage across grassland meadows, monitor energy depletion bars, and see predators track prey based on real ecological parameters.
The simulation launches instantly in any modern web browser with no download or login required. Download the free 24-page companion mission journal to provide your students with structured data tables, food web mapping templates, and inquiry questions.
Interact with living food webs, test trophic cascades, and track population curves in our free browser simulation.
LAUNCH PRAIRIE SIMULATORFrequently Asked Questions About Prairie Food Web Diagrams
Questions frequently asked by middle school science teachers and biology students regarding food web diagrams.
What is the main difference between a prairie food chain and a prairie food web?
Which direction do the arrows point on a prairie food web diagram?
What happens to a prairie food web if primary producers are damaged by drought?
Why are decomposers important in a prairie food web diagram?
How many trophic levels are typically in a Great Plains food web?
Free Interactive Grassland Science Tools and Curriculum Guides
Enhance your classroom ecosystem unit with these comprehensive free resources:
Explore species life cycles and adaptations in our foundational prairie food chain guide.
Study keystone burrowing colonies in our prairie dog food web guide.
Meet the herbivores that support the entire biome in our grassland primary consumers guide.
Analyze energy pyramid mathematics in our red-tailed hawk trophic level guide.
Discover teacher resources and classroom session codes on our educator dashboard.
Comprehensive student lab sheets, hypothesis logs, and food web diagramming templates designed to accompany the 3D ecosystem simulation.
GET FREE MISSION LOGBOOK (PDF)24-Page Ecosystem Companion Mission Journal (PDF)
Download the complete 24-page printable student mission journal to accompany your 45-minute interactive classroom lab with data tracking tables and reflection prompts.