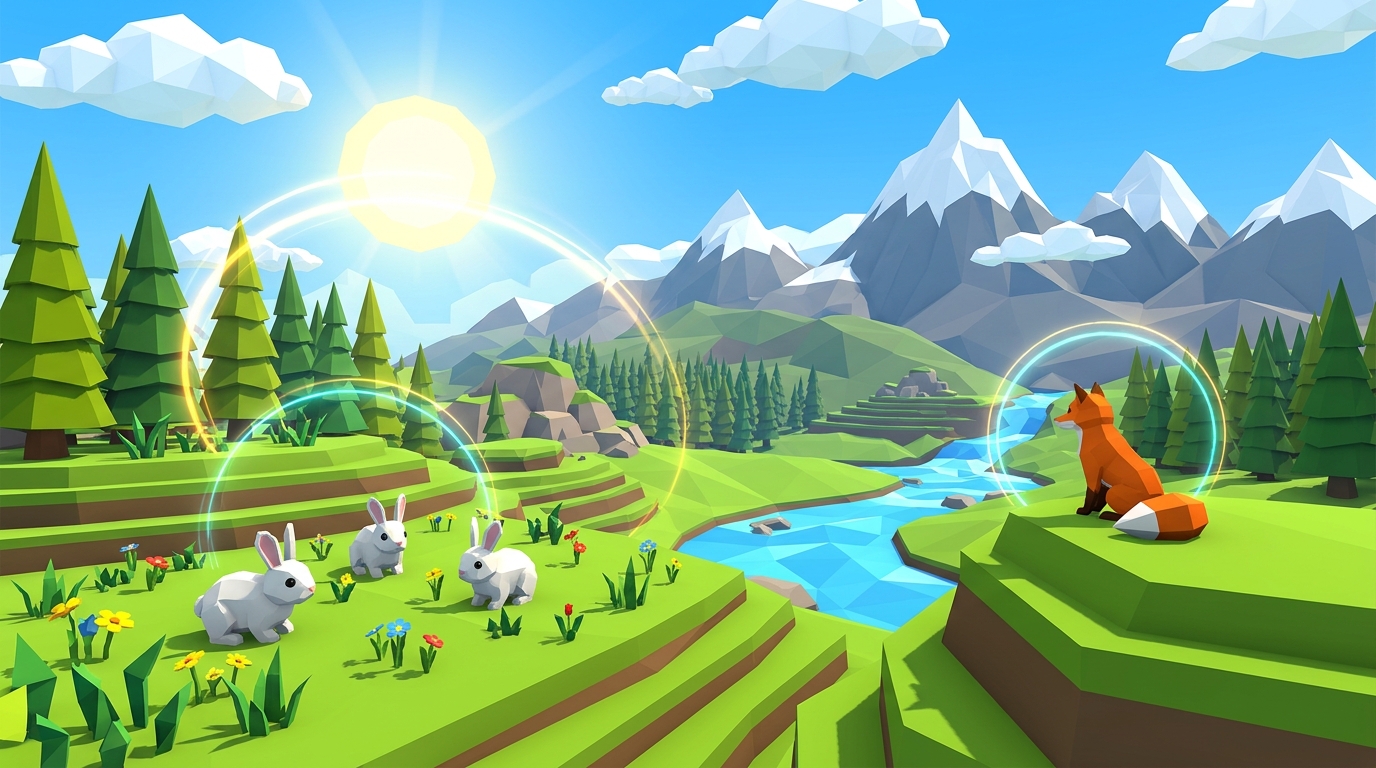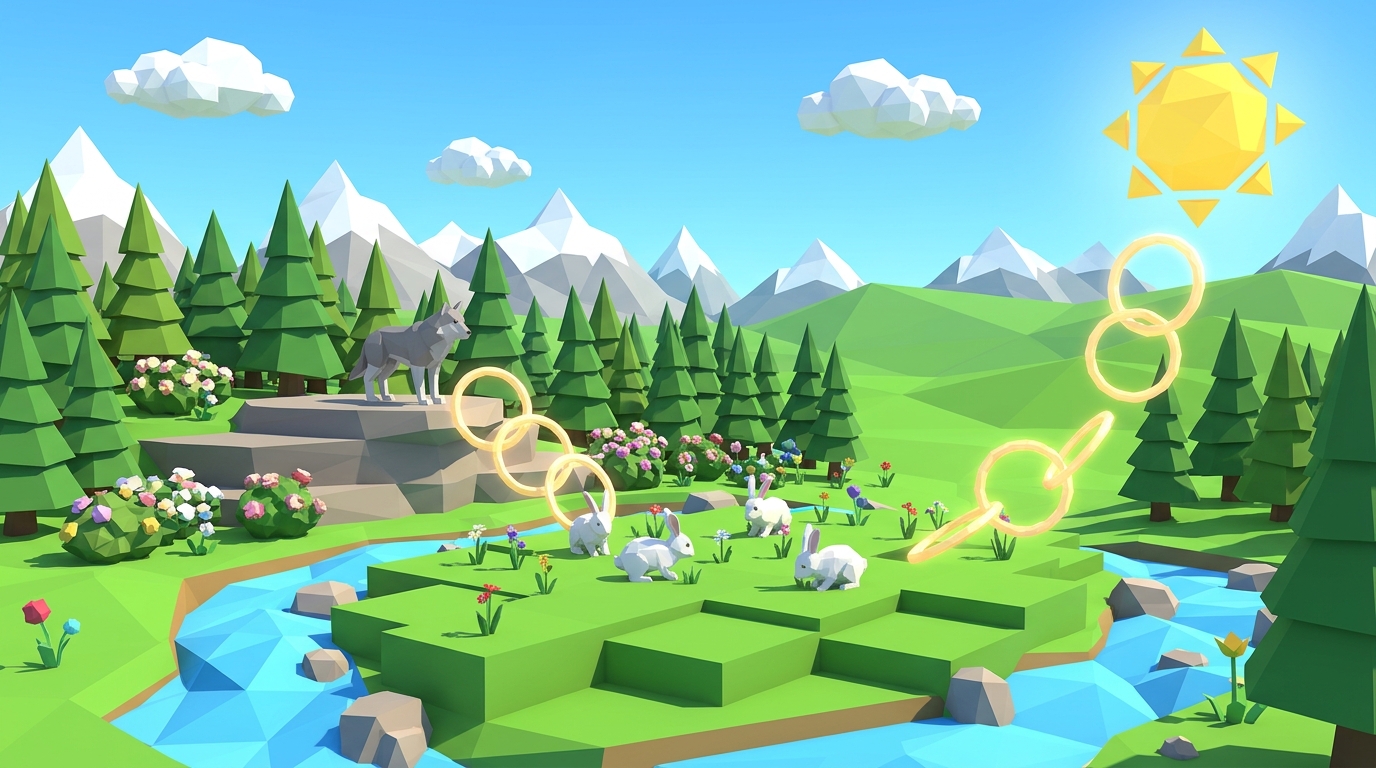

The 70-Year Absence: What Happened When Yellowstone Lost Its Wolves
In the early decades of the twentieth century, gray wolves were systematically eliminated from Yellowstone National Park. By 1926, the last native wolf pack was gone. At the time, early park managers assumed that removing large carnivores would protect beloved herbivores like elk, mule deer, and moose.
Instead, removing the apex predator triggered an ecological disaster known as a trophic cascade. Without natural predators to keep herds vigilant and moving, Yellowstone elk populations exploded. Even worse, the elk ceased moving across the landscape, settling comfortably in open river valleys and grazing tender young willow, aspen, and cottonwood saplings down to bare roots.
Without young trees to shade the water or anchor riverbanks with root networks, riverbanks collapsed into muddy channels. Stream temperatures spiked, trout populations plummeted, and songbirds that nested in deciduous canopies vanished completely.
An ecosystem without top predators is like a car without brakes: secondary consumers and primary producers collapse under the uncontrolled weight of unchecked herbivore populations.
The 1995 Reintroduction: The Domino Effect That Reshaped Rivers
In 1995, wildlife biologists took a daring step: they captured 14 wild gray wolves in Canada and released them into Yellowstone National Park. What followed is celebrated today as one of the most astonishing ecological recoveries in modern science.
The wolves began hunting elk, but the total number of elk consumed was only part of the story. More importantly, the wolves created what ecologists call "the ecology of fear." Elk learned to avoid exposed valleys, narrow gorges, and river corridors where they could be easily ambushed.
With grazing pressure lifted from the river valleys, willow and cottonwood trees surged in height, growing over five times taller in just six seasons. This botanical regeneration triggered a remarkable domino effect:
1. Songbirds Returned: Warblers, flycatchers, and thrushes nested in the newly flourishing deciduous canopy.
2. Beavers Re-Engineered the Wetlands: Beavers arrived to harvest the mature willow wood, building dams that slowed river currents and created deep ponds for amphibians, otters, and native cutthroat trout.
3. Soil Root Stabilization: Deep root structures locked down riverbank silt, preventing erosion.
4. Hydrological Narrowing: The rivers stopped meandering erratically across wide mudflats, forming deep, cool, stable swimming channels with clean gravel beds.
Trophic Cascades Breakdown: Top-Down vs Bottom-Up Ecological Forces
Ecologists classify food web interactions into two primary directional forces: top-down cascades (driven by apex predator control) and bottom-up cascades (driven by solar energy, water, and nutrient availability for primary producers).
Here is how these distinct ecosystem dynamics operate across real-world biomes:
| Cascade Type | Primary Driver | Mechanism of Action | Trophic Level Response | Real-World Example |
|---|---|---|---|---|
| YELLOWSTONE MODELTop-Down Cascade | Apex Predators / Tertiary Consumers | Predators suppress herbivore numbers and alter grazing behavior (Ecology of Fear). | Plant biomass increases; lower trophic biodiversity surges. | Yellowstone wolves regulating elk, allowing willow and aspen recovery. |
| Bottom-Up Cascade | Abiotic Resources / Primary Producers | Sunlight, rainfall, or mineral fertilizers boost plant growth from the foundation. | Higher primary producer biomass supports larger herbivore and carnivore numbers. | Spring rainfall surges creating prairie forage booms for rabbits and foxes. |
| Trophic Deadlock (Overgrazing) | Apex Predator Extirpation | Herbivores exceed carrying capacity without predation limits. | Severe plant biomass collapse, topsoil erosion, and subsequent herd starvation. | Yellowstone elk overgrazing riverbanks between 1926 and 1995. |
| Marine Trophic Cascade | Keystone Marine Predators | Sea otters consume herbivorous sea urchins. | Kelp forests flourish, providing nursery habitats for fish, seals, and invertebrates. | Pacific Northwest sea otter recovery restoring coastal kelp forests. |
Exploring Trophic Cascades: Worksheet Answer Key & Discussion Guide
If your student or classroom is working through trophic cascade inquiry assignments (such as the HHMI BioInteractive trophic cascades activity or our companion lab logs), here is a structured discussion and answer key to guide deep conceptual mastery:
What is the relationship between wolf presence, elk behavior, and willow height?
Wolf presence creates predatory risk zones. Elk spend less time lingering in vulnerable river bottoms, allowing willow saplings to grow uninterrupted past browse height (above 2 meters).
How did wolves indirectly change non-living (abiotic) factors like riverbanks?
Wolves allowed willow and aspen roots to re-establish along riverbanks. These root networks bound loose soil, reduced water erosion, stabilized river channels, and created clear, deep pools.
Why are gray wolves classified as a "keystone species" rather than just another predator?
A keystone species exerts an ecological impact that is disproportionately large relative to its abundance. Removing 14 wolves altered hundreds of species and physical landscape features throughout Yellowstone.
How does a trophic cascade differ from a simple linear food chain?
A food chain shows a single direct line of energy transfer (Grass -> Elk -> Wolf). A trophic cascade demonstrates multi-level indirect consequences extending across non-adjacent trophic levels (Wolf -> Grass, Birds, Beavers, Rivers).
How to Teach Trophic Cascades: A 45-Minute Dual-Format Inquiry Routine
Rather than simply showing students a passive video, guide them to discover trophic cascades through active hypothesis testing and 3D simulation experimentation:
Step 1 (Pencil-First Prediction): In their printable Expedition Journal, have students draw a 4-tier trophic pyramid and predict what happens to plant biomass if all apex predators are removed.
Step 2 (3D Simulation Trial): Launch Level 4: The Gray Shadow in your browser. Have students adjust predator numbers and observe real-time population curves as herbivore spikes lead to vegetation crashes.
Step 3 (Coordinate Graphing): Students plot time on the X-axis and population count on the Y-axis, observing the oscillating wave patterns of predator-prey dynamics.
Step 4 (Claim-Evidence-Reasoning Synthesis): Students complete a CER reflection: "Does adding apex predators increase or decrease total plant cover? Defend your claim using numerical trial data."
To explore more multi-grade science units, view our free homeschool science curriculum guide and review our guide on how to make a food chain.
Frequently Asked Questions About Trophic Cascades
Here are answers to the most common questions students, parents, and educators ask about trophic cascades and keystone species:
What is the simplest definition of a trophic cascade for kids?
How did wolves changing elk behavior help beavers in Yellowstone?
What is the difference between a top-down and bottom-up cascade?
Are there other examples of trophic cascades besides Yellowstone?
How can students test trophic cascades in the Praxos simulation?
Yellowstone Trophic Cascade Flowchart & Student Lab Logbook
A free printable 24-page student lab logbook featuring trophic cascade cause-and-effect flowcharts, predator-prey coordinate graphing sheets, and Claim-Evidence-Reasoning (CER) reflection prompts.