What Do Arrows Mean in a Food Web?
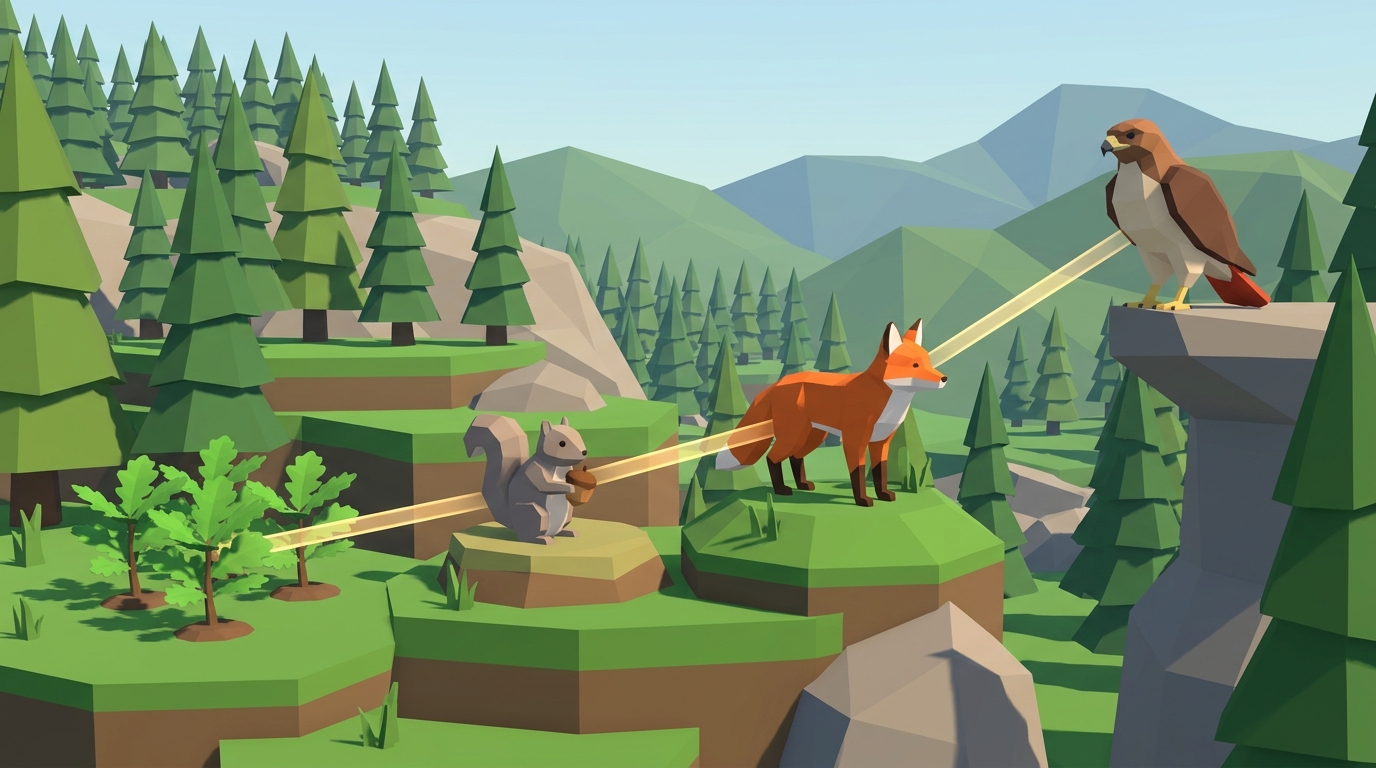
In a food web or food chain diagram, arrows point FROM the organism being eaten TO the organism doing the eating. They represent the direction of biological energy flow and organic biomass transfer, not the movement of physical hunting.
For example, in the relationship Grass -> Rabbit -> Fox, the arrow points from the grass into the rabbit because chemical energy (glucose) transfers into the rabbit’s body. Then, the arrow points from the rabbit into the fox because the fox absorbs the calories stored in the rabbit’s tissue.
The arrow points into the stomach of the animal that is eating. It shows where the energy goes.
The #1 Student Misconception: Who Is Chasing Whom?
When elementary and middle school students first encounter ecological diagrams, their intuition often misleads them. Many students assume the arrow indicates an attack vector or chase direction, leading them to draw arrows pointing from the predator toward the prey (e.g., Hawk -> Mouse).
This confusion arises because arrows in everyday life (such as road signs or comic strips) indicate motion toward a target. In biological science, however, arrows represent a thermodynamic currency exchange: energy leaving the consumed organism and entering the consumer.
Once learners understand that an arrow represents calories moving into an eater’s body rather than an arrow shot at prey, exam diagram accuracy reaches near 100%.
Food Chain vs. Food Web Arrows: Key Differences
While both diagrams use arrows to map energy, their structure reflects different levels of ecological complexity:
| Diagram Feature | Food Chain Arrows | Food Web Arrows |
|---|---|---|
| Arrow Pattern | Single linear path (one arrow per organism) | Complex branching network (multiple arrows per organism) |
| Energy Representation | Isolated feeding relationship | Complete ecosystem energy distribution |
| Dietary Realism | Oversimplified (assumes one food source) | Highly realistic (shows omnivory and multiple prey options) |
| Resilience Modeling | Vulnerable (removing one link breaks chain) | Resilient (shows alternative energy pathways) |
Why Are Food Webs More Realistic Than Food Chains?
In natural ecosystems, animals almost never rely on a single food source. A red fox does not eat only field mice; it hunts rabbits, songbirds, beetles, and grazes on wild berries. If disease reduces the mouse population, the fox shifts its diet to grasshoppers and fruit, preventing starvation.
Food webs illustrate this biological redundancy. By showing interconnected feeding pathways, food webs explain why ecosystems possess natural buffering capacity against environmental shocks and seasonal fluctuations.
How to Read Multi-Tier Food Web Diagrams
To trace energy accurately through any complex food web diagram, follow this systematic 3-step reading method:
Step 1: Locate the Autotrophic Base. Find organisms that have arrows pointing only AWAY from them (plants, algae, phytoplankton). These are your primary producers capturing solar energy.
Step 2: Trace Primary and Secondary Consumers. Follow arrows from producers into primary consumers (herbivores). Organisms with arrows coming from plants and pointing toward carnivores are secondary consumers.
Step 3: Identify Apex Predators and Decomposers. Find organisms at the top with arrows pointing only INTO them (tertiary consumers and apex raptors), or trace arrows from all trophic levels pointing into soil fungi and bacteria (decomposers).
Observe Dynamic Energy Flow in a Free 3D Simulation
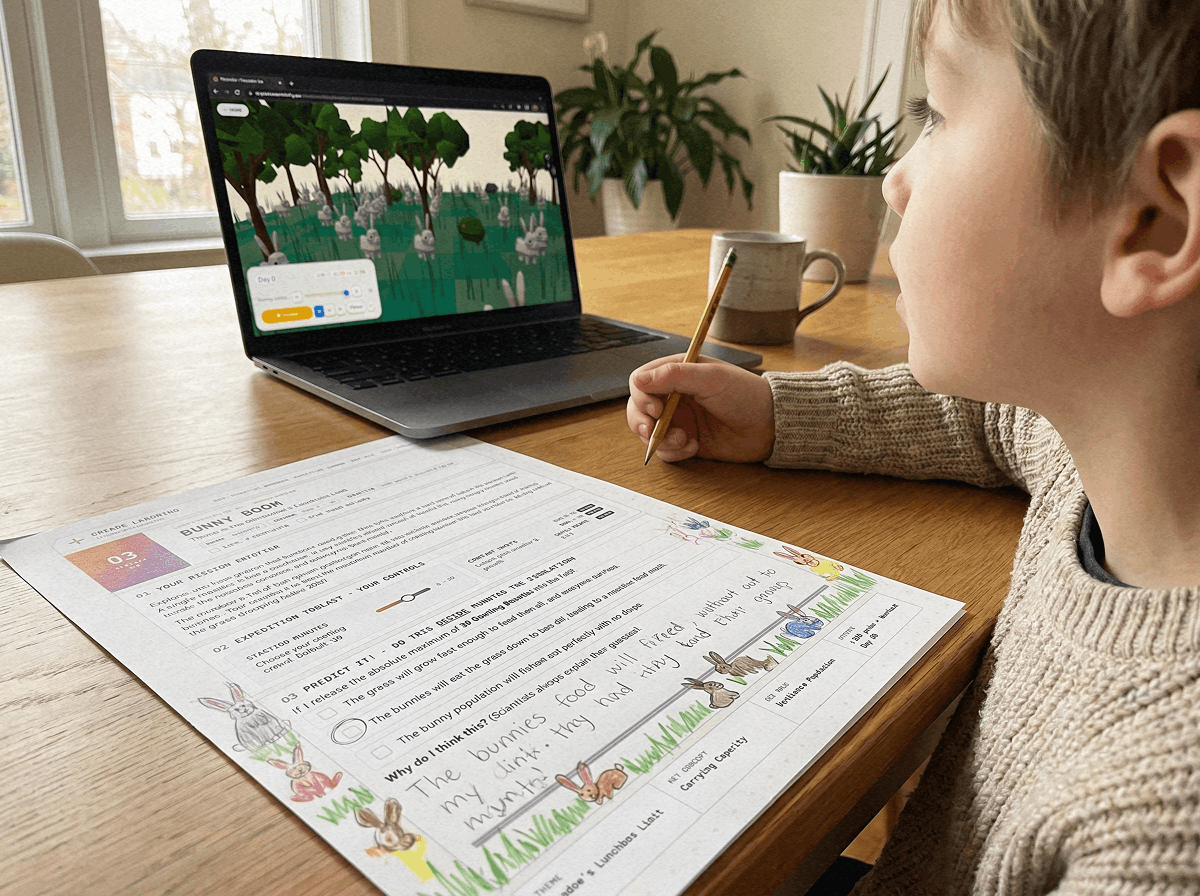
Instead of merely looking at static paper arrows, students can observe dynamic energy flow in action with Praxos Ecosystem.
Adjust solar radiation sliders, introduce primary consumers, and watch live energy transfers illuminate the 3D biome while real-time population trend charts track ecosystem balance.
All 10 simulation levels and the 24-page Expedition Science Journal are 100% free with email. Level 1 starts instantly in your web browser with zero registration.
Model multi-tier food webs, trophic energy transfer, and carrying capacity in our free browser sandbox.
LAUNCH FREE 3D LABFree 24-Page Expedition Science Journal
Includes food web diagram worksheets, arrow direction practice sheets, and reflection prompts.