The Power of Dynamic Simulation in Teaching Population Dynamics
The relationship between predator and prey is one of the most exciting topics in middle school and high school life science, yet traditional curricula often reduce it to a simple linear narrative: wolves eat rabbits, so more wolves equal fewer rabbits. This oversimplification obscures the profound beauty of systemic feedback loops and carrying capacity limits.
Alfred Lotka and Vito Volterra first formulated the differential equations governing predator-prey oscillation over a century ago. When prey numbers increase, predators encounter more food, leading to increased predator reproduction after a characteristic reproductive time lag. However, as the predator density reaches its crest, prey consumption outpaces prey birth rates, triggering an abrupt collapse in prey numbers. This food shortage subsequently starves the predator population, allowing the surviving prey to recover and restarting the perpetual oscillation.
In a passive worksheet, students can only look at pre-rendered graph curves. But when students interact with a dynamic 3D simulator, they directly operate the levers of this living equation. By varying prey birth rates, predator hunting radii, and vegetation replenishment, learners gain an intuitive grasp of ecological resilience and extinction tipping points.
Predator population crests consistently lag behind prey crests because gestation and maturation take time. This lag is precisely why simple ecosystems naturally oscillate rather than settling into a flat equilibrium.
Top 5 Predator-Prey Simulations and Games Ranked
Here is our evaluation of the best predator-prey simulators available online, assessed for pedagogical depth, ease of classroom implementation, and mathematical validity:
Praxos Learning: Apex Predator & Carrying Capacity Sandbox
Intuitive spatial population modeling, overgrazing feedback, and classroom labs (Grades 4 to 9)
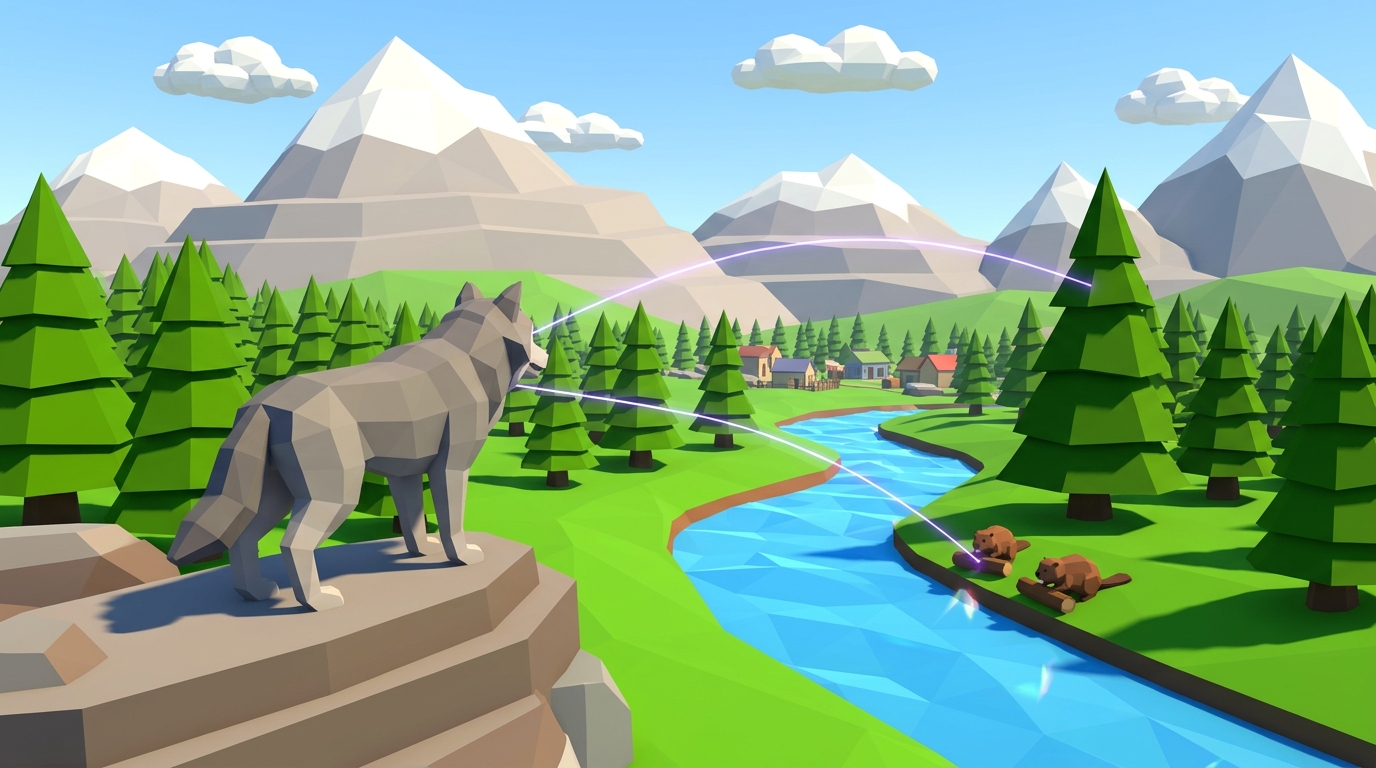
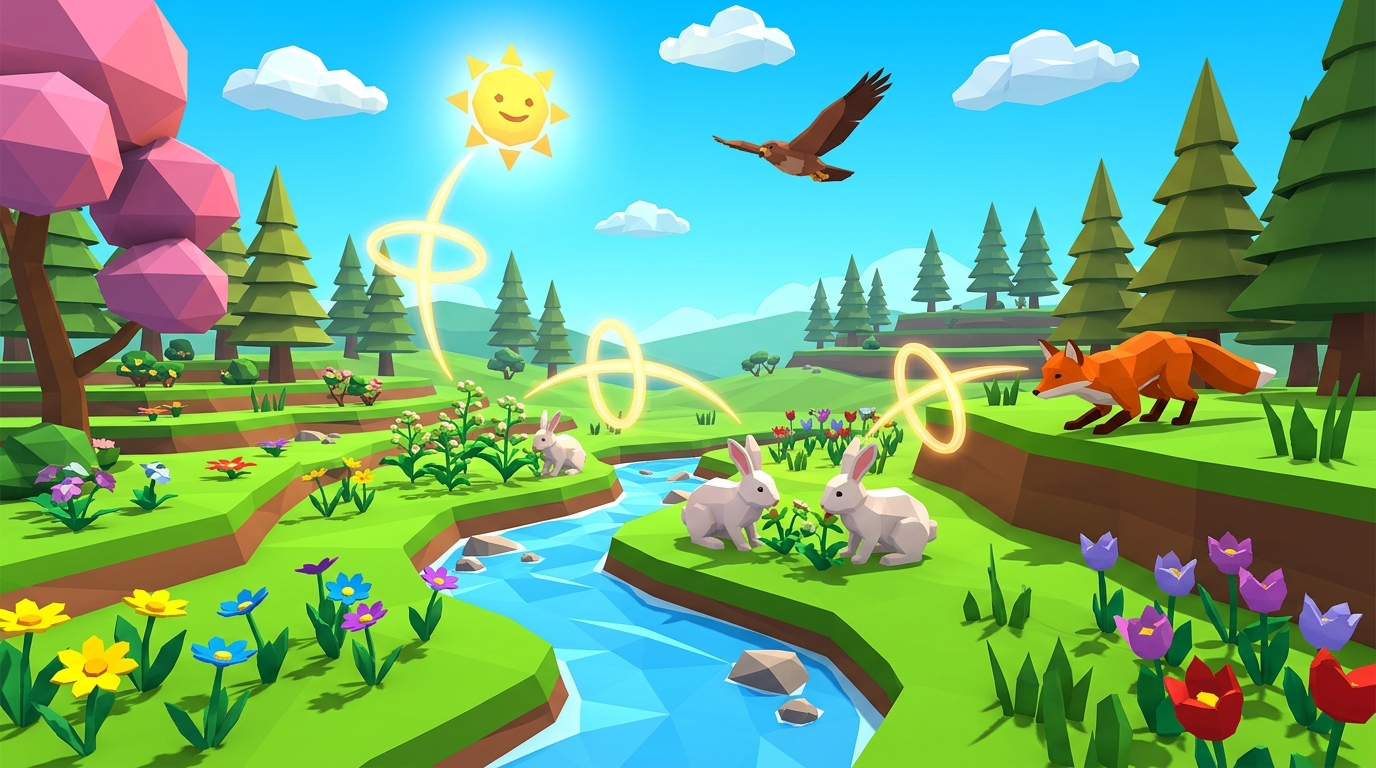
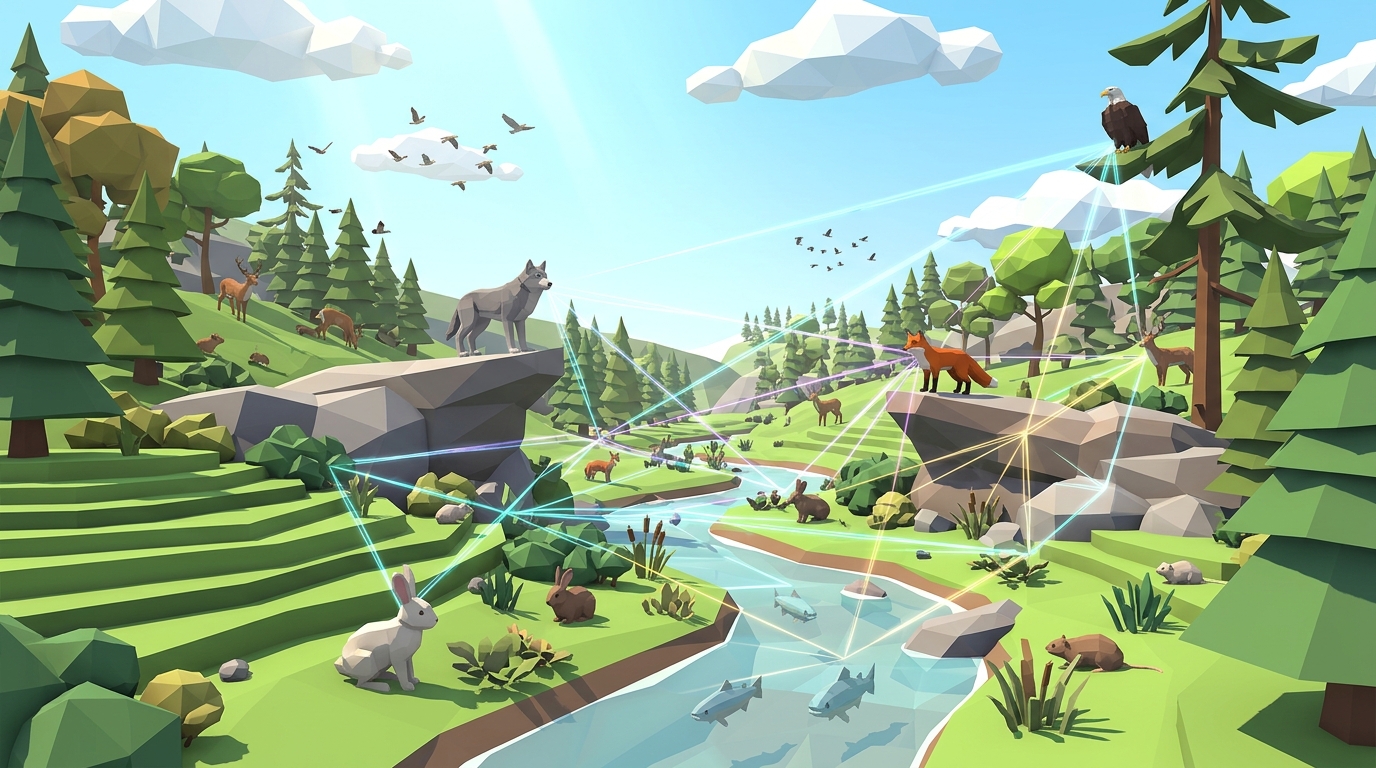
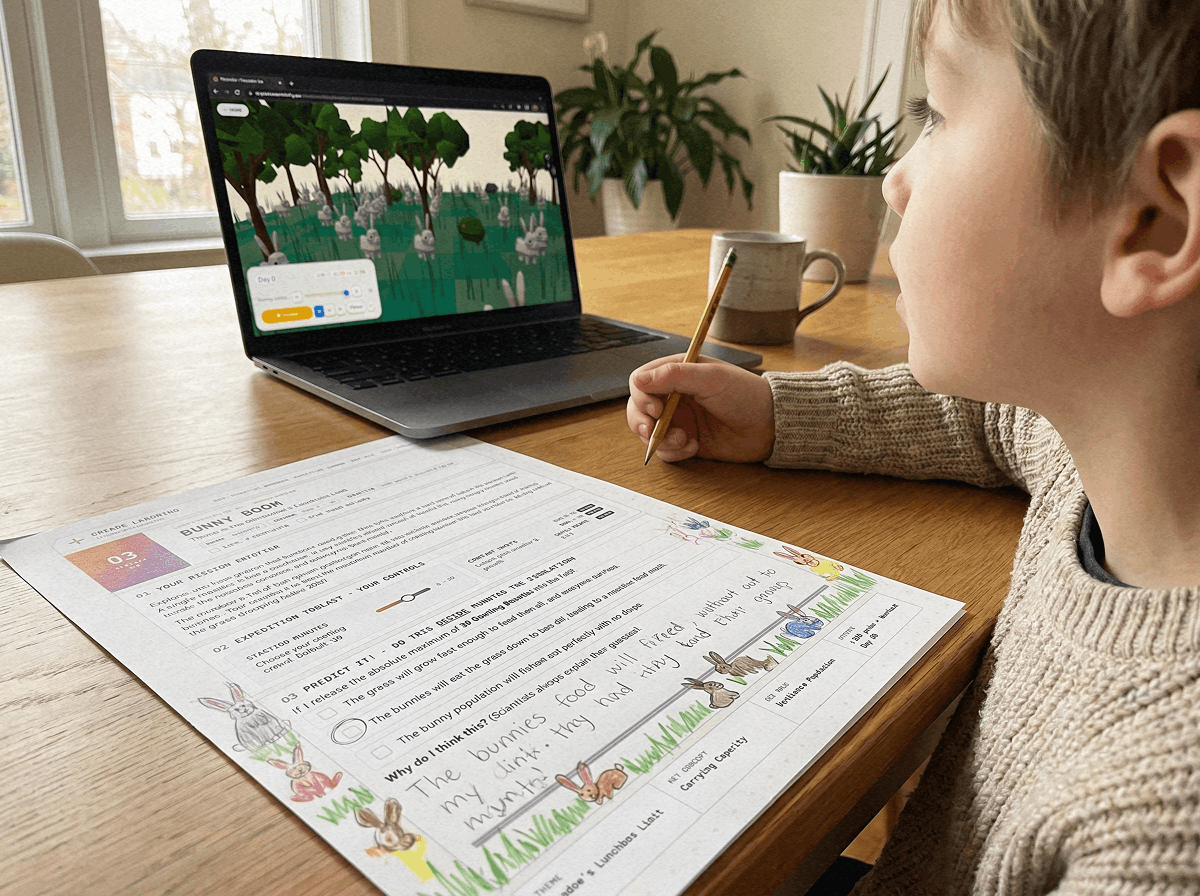
Praxos combines a browser-based 3D environment with authentic multi-trophic equations. In Level 3 (*Bunny Boom*) and Level 4 (*The Gray Shadow*), students witness how an uncontrolled rabbit population obliterates grasses, leading to famine, before learning how apex wolves stabilize the entire plant-herbivore community.
- ✓Real-time synchronized population graph overlays alongside 3D spatial organism behavior
- ✓Zero installation: runs smoothly on Chromebooks, iPads, and standard laptops
- ✓Includes free 24-page printable Student Science Journal with hypothesis worksheets
- ✓Aligned with NGSS MS-LS2-1, MS-LS2-2, and MS-LS2-4 standards
NetLogo: Wolf-Sheep Predation Model
Algorithmic computer science and upper-grade biological modeling (Grades 8 to 12)
The NetLogo Wolf-Sheep model is a classic agent-based simulation where individual sheep and wolves wander a grid, expending energy and reproducing probabilistically. Highly customizable for advanced classes, though its retro 2D pixel interface can feel dated for younger students.
- ✓Complete parameter control over energy loss, grass regrowth time, and reproduction chance
- ✓Deeply respected academic platform developed at Northwestern University
- ✓Steeper learning curve and technical interface for elementary and middle schoolers
PhET: Natural Selection & Rabbit Population Lab
Connecting predator hunting success to camouflage and physical mutations (Grades 6 to 10)
PhET allows students to introduce wolves into a rabbit population while toggling genetic traits like white vs. brown fur and long vs. short teeth. Excellent for understanding differential survival, though focused more on genetics than continuous multi-species community ecology.
- ✓Visualizes how predatory pressure drives evolutionary adaptation
- ✓Includes population charts tracking dominant and recessive alleles
- ✓Does not model predator starvation or predator population fluctuations
Annenberg Learner: Ecology Lab Simulator
Multi-trophic feeding level comparisons and theoretical ecology (Grades 7 to 10)
A 2D web simulation that allows students to adjust the starting biomass of two plant species, two herbivores, and an apex carnivore. Demonstrates competitive exclusion and predation trade-offs effectively.
- ✓Clear numerical readouts and biomass graph comparisons
- ✓Covers both predation and inter-species competition
- ✓Static graphical presentation without spatial 3D animal interactions
HHMI BioInteractive: Exploring Trophic Cascades
Connecting predator balance to real historical ecology studies (Grades 7 to 12)
Based on Dr. Robert Paine and Dr. James Estes real-world field research on kelp forests, sea otters, and Yellowstone wolves. Features rigorous interactive data analysis and video interviews with prominent ecologists.
- ✓Presents authentic scientific field data from real ecological studies
- ✓Superb for AP Biology and advanced middle school honors units
- ✓Structured as an interactive inquiry case study rather than a real-time game sandbox
Feature Comparison: 2D Equation Plots vs 3D Spatial Sandboxes
Here is how leading predator-prey simulators compare in features, modeling depth, and classroom practicality:
| Feature | Praxos Learning | NetLogo Web | PhET Natural Selection | HHMI BioInteractive |
|---|---|---|---|---|
| Visual EngineVisual Representation | Immersive 3D Habitat Sandbox | 2D Pixel Grid Cells | 2D Animated Cartoon Habitat | Interactive Graphs & Real Video |
| Mathematical Core | Coupled Population Feedback Loops | Stochastic Agent-Based Rules | Mendelian Selection Probabilities | Empirical Field Study Data |
| Plant Carrying Capacity | Dynamic Vegetation Growth & Regrowth | Optional Grass Grid Toggle | Unlimited Food / Seasonal Toggle | Trophic Cascade Matrix |
| Ease of Use for Students | High (Intuitive Slider Controls) | Moderate (Dense UI & Sliders) | High (Accessible Visual Levers) | Moderate (Requires Reading & Data Analysis) |
| Chromebook Compatibility | 100% WebGL Native (Zero Plugins) | HTML5 Web App (Can Lag with High Agents) | HTML5 Canvas Native | Web Browser Compatible |
| Printable Science Lab Sheets | Included (24-Page Mission Logbook) | User-Created Handouts Only | Community-Submitted Worksheets | Included Teacher PDF Guides |
Experiment with Lotka-Volterra Population Waves
Run real-time predator-prey experiments in full 3D. Control rabbit reproduction and introduce gray wolves to stabilize the prairie before catastrophic overgrazing wipes out the habitat.
How Negative Feedback Loops Prevent Total Habitat Extinction
Through hands-on trial and error, students discover that predators are not ecological villains: they are essential stabilizers that prevent the destruction of foundational plant life:
Phase 1: The Prey Boom (Exponential Growth)
With abundant green vegetation and low predator pressure, the prey population expands exponentially toward its biotic potential. Graphs show steep upward curves in herbivore headcounts.
Phase 2: The Predator Response (Lagged Surge)
Predators experience high hunting encounter rates. Well-fed predators successfully nurse larger litters, causing predator headcounts to increase several simulation weeks after the prey surge.
Phase 3: The Overgrazing Crash (Carrying Capacity Breach)
Heavy grazing strips the terrain bare faster than grass can photosynthesize. Stressed by both food scarcity and intense hunting pressure, the prey population drops precipitously.
Phase 4: Predator Correction & Habitat Recovery
Faced with sparse prey, predators starve or disperse. Reduced grazing pressure allows plant roots to regenerate, restoring soil nutrients and setting the stage for the next stable cycle.
Classroom Lab Protocol: Testing Carrying Capacity and Tipping Points
Run this 45-minute inquiry lab in your science classroom to guide students through hypothesis-driven data collection:
1. Research Question (5 Minutes): What happens to an ecosystem when apex predators are eliminated? Students write their hypothesis in their science notebooks.
2. Baseline Simulation (15 Minutes): Students launch Praxos 3D Simulation Level 3 (*Bunny Boom*). Students record peak rabbit numbers, minimum grass coverage, and elapsed days until the first mass starvation event.
3. Predator Introduction Experiment (15 Minutes): Students advance to Level 4 (*The Gray Shadow*). Students introduce 2, 4, and 8 wolves across separate trials, recording the resulting amplitude of the population waves on their data logbook graphing sheets.
4. Class Discussion & Systems Synthesis (10 Minutes): Compare findings as a class. Emphasize why removing predators leads to long-term biodiversity loss rather than a peaceful wildlife haven.
Introduce apex predators into an overpopulated prairie habitat and watch how balancing feedback loops pull the ecosystem back from the brink of total collapse.
PLAY LEVEL 4 SIMULATIONFrequently Asked Questions About Predator-Prey Simulations
Helpful answers to common educator questions regarding population dynamics games:
What is the Lotka-Volterra model in simple terms for kids?
Why do rabbit and wolf populations oscillate instead of staying flat?
Can predator-prey simulations be used for middle school NGSS standards?
Do students need coding experience to use Praxos predator-prey labs?
Additional Free Population Ecology Resources and Guides
Continue expanding your classroom ecology curriculum with these dedicated resources:
Discover broader ecosystem tools in our interactive food chain games catalog.
Learn about keystone predator dynamics in our trophic cascade simulation online case study.
Read our guide on predator-prey relationships with 5 real examples.
Explore elementary food web lessons in our food chain games for the classroom guide.
Set up your school or homeschool co-op on our teacher dashboard.
Get 24 pages of printable predator-prey wave graphing templates, carrying capacity calculation tables, and experiment logs.
DOWNLOAD EXPEDITION LOGBOOK (PDF)Predator-Prey Graphing & Systems Journal (PDF)
Printable population wave graphing sheets, phase-plane analysis templates, and hypothesis logs for life science ecology units.