The Power of Displaced Oceans: Why Tsunamis Are Not Normal Waves
During the fiercest hurricane or typhoon, gale-force winds whip the surface of the sea into towering whitecaps and roaring breakers. Yet no matter how violent the storm, the agitation remains confined to the surface layer of the ocean: dive just fifty feet below the waves in a submarine, and the water is completely calm and serene. The wavelength of wind-driven waves rarely exceeds 100 to 200 meters, and their energy is strictly superficial.
A tsunami, by contrast, is not created by wind, weather, or tides. It is a full-column hydrodynamic displacement. From the pitch-black ocean floor 4,000 meters (13,000 feet) down all the way to the sunlit surface, the entire mass of the ocean moves as one unified kinetic body. When a tsunami approaches a coastline, it does not crash and dissipate like a surfing wave: it arrives as an endless, rapidly rising ocean surge that floods miles inland.
To help middle school students visualize this immense energy, I use the analogy of a hydraulic swimming pool floor: imagine swimming in an Olympic-sized swimming pool. If a giant hydraulic piston suddenly shoves the entire tiled concrete floor upward by three feet in half a second, what happens to the water? The entire body of water above it is violently hoisted into the air. That displaced mound of water has nowhere to go but outward in all directions, slamming against the pool tiles. In planetary geophysics, that hydraulic piston is hundreds of miles of tectonic seafloor snapping upward during a subduction earthquake, and the pool is an entire ocean basin.
The Mechanics of Megathrust Rupture: Centuries of Locked Strain
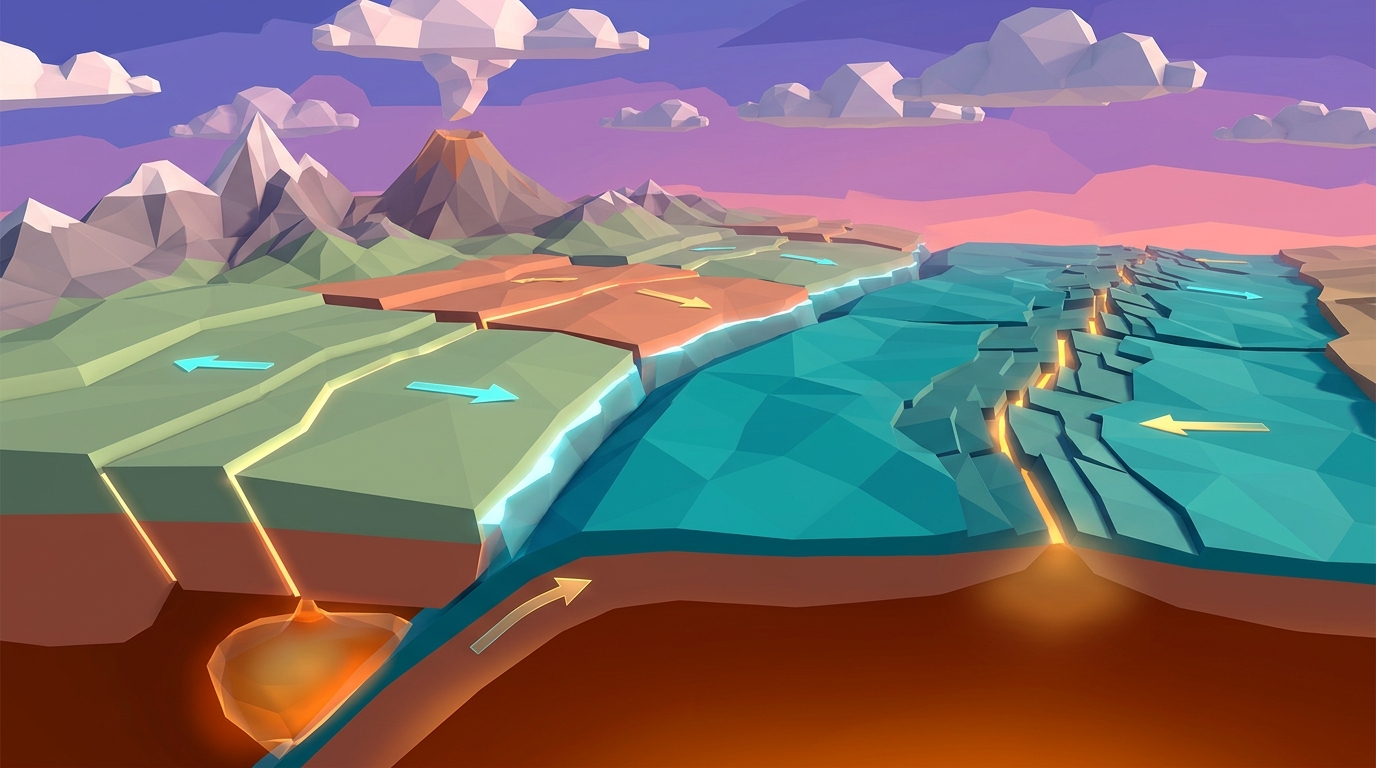
The largest earthquakes on Earth do not occur along transform faults like California's San Andreas Fault; they happen along subduction megathrust boundaries where dense oceanic lithosphere plunges beneath continental plates. Tsunami generation follows a precise, centuries-long cycle of elastic deformation:
1. The Interseismic Locking Phase (Centuries of Compression): As the oceanic plate subducts at a rate of several centimeters per year, the contact zone between the two plates remains completely locked by colossal friction. Because the descending slab will not let go, the leading edge of the overriding continental plate is dragged downward and squeezed backward. Over 300 to 500 years, the continental margin acts like a giant recurve archery bow, bending downward and storing trillions of gigajoules of elastic potential energy.
2. The Coseismic Rupture Phase (Seconds of Cataclysm): Eventually, accumulated shear stress exceeds the frictional resistance of the fault rocks. In a span of two to three minutes, the megathrust ruptures along hundreds of kilometers of fault line. The leading edge of the continental plate springs violently upward and seaward by 5 to 20 meters (16 to 65 feet), while coastal landmasses dozens of kilometers inland drop down (subsidence).
3. Ocean Column Displacement: Because water is virtually incompressible, this sudden vertical uplift of thousands of square kilometers of seabed instantly heaves trillions of liters of water upward, creating a broad, subtle mound on the ocean surface. Gravity immediately pulls this water mound back down, launching tsunami wave trains outward in opposite directions: one wave racing toward distant continents across the deep ocean, and another racing toward nearby coastal shores.
The Physics of Wave Propagation: From Jetliner Speeds to Coastal Shoaling
The journey of a tsunami from deep water to the coastline is governed by two fundamental laws of fluid dynamics that students can model mathematically:
Deep-Ocean Wave Velocity: In deep water (average depth d = 4,000 meters), a tsunami's wavelength (L = 100 to 200 kilometers) is enormously larger than the water depth. Because the depth-to-wavelength ratio is under 0.05, tsunamis behave physically as shallow-water gravity waves across the entire ocean. Their propagation velocity is governed strictly by the equation: v = √(g · d), where g is gravitational acceleration (9.8 m/s²) and d is ocean depth in meters.
Plugging in standard open-ocean depth: v = √(9.8 · 4000) ≈ 198 m/s ≈ 713 km/h (443 mph). In deep ocean trenches, speeds exceed 800 km/h (500 mph): matching the cruising velocity of a Boeing 747 jetliner! Yet in the open sea, this energy is spread across a 150-kilometer wavelength, resulting in a wave height of under 1 meter (3 feet). Ships sailing over a tsunami in deep water never even feel it pass.
Coastal Wave Shoaling and Amplification: As the wave approaches the continental shelf, water depth d plummets from 4,000 meters down to 20 meters. According to the velocity equation, wave speed drops sharply from 700 km/h to less than 50 km/h. However, the total kinetic and potential energy of the wave must be conserved. While the front of the wave slows down, the rear of the wave in deeper water is still barreling forward at high speed.
This speed difference compresses the wave: the 150-kilometer wavelength is squeezed into just 2 to 3 kilometers. Deprived of horizontal space, the wave energy is forced vertically upward in a process known as coastal shoaling (Green's law). The barely perceptible 1-meter open-ocean swell rears up into an enormous, multi-story wall of water 10, 20, or even 40 meters high that crashes ashore with catastrophic hydraulic force.
Comparative Analysis: History's Most Catastrophic Megathrust Tsunamis
The table below compares the earthquake magnitude, vertical seafloor displacement, propagation speeds, and coastal runup heights of major subduction zone tsunamis:
| Event & Subduction Frontier | Year | Moment Magnitude (Mw) | Vertical Seafloor Uplift | Open-Ocean Wave Speed | Peak Coastal Runup Height |
|---|---|---|---|---|---|
| Deadliest Tsunami in Recorded HistoryIndian Ocean Tsunami (Sumatra-Andaman) | 2004 | Mw 9.1 - 9.3 | ~10 to 15 meters | ~800 km/h (500 mph) | 34.8 m (114 ft) at Banda Aceh, Indonesia |
| Tohoku Tsunami (Japan Trench) | 2011 | Mw 9.0 - 9.1 | ~7 to 10 meters (50m horizontal slip) | ~750 km/h (465 mph) | 40.5 m (133 ft) at Miyako, Iwate Prefecture |
| Great Chilean Tsunami (Valdivia) | 1960 | Mw 9.5 (Highest recorded) | ~15 to 20 meters | ~770 km/h (480 mph) | 25.0 m (82 ft) in Chile; crossed Pacific to Japan |
| Great Alaska Tsunami (Prince William Sound) | 1964 | Mw 9.2 | ~9 to 11 meters | ~740 km/h (460 mph) | 67.0 m (220 ft) in Valdez Arm inlet |
| Cascadia Megathrust (Pacific Northwest) | 1700 | Mw ~9.0 | ~8 to 12 meters | ~760 km/h (470 mph) | ~15 to 20 m; recorded in Japanese orphan tsunami logs |
Simulate Megathrust Tsunamis in Interactive 3D
Trigger subterranean megathrust ruptures along an active subduction trench. Watch vertical seafloor uplift heave the ocean column, track high-speed wave propagation across open ocean bathymetry, and observe coastal wave shoaling amplification in real time.
Teaching this topic tomorrow? Download the Free NGSS Student Lab Sheet (Printable PDF)
Equip your middle school earth science students with printable tsunami wave velocity worksheets, coastal shoaling calculation grids, and NGSS MS-ESS3-2 natural hazards lab pages.
Hands-On Classroom Inquiry: 4-Step Tsunami Physics & Shoaling Protocol
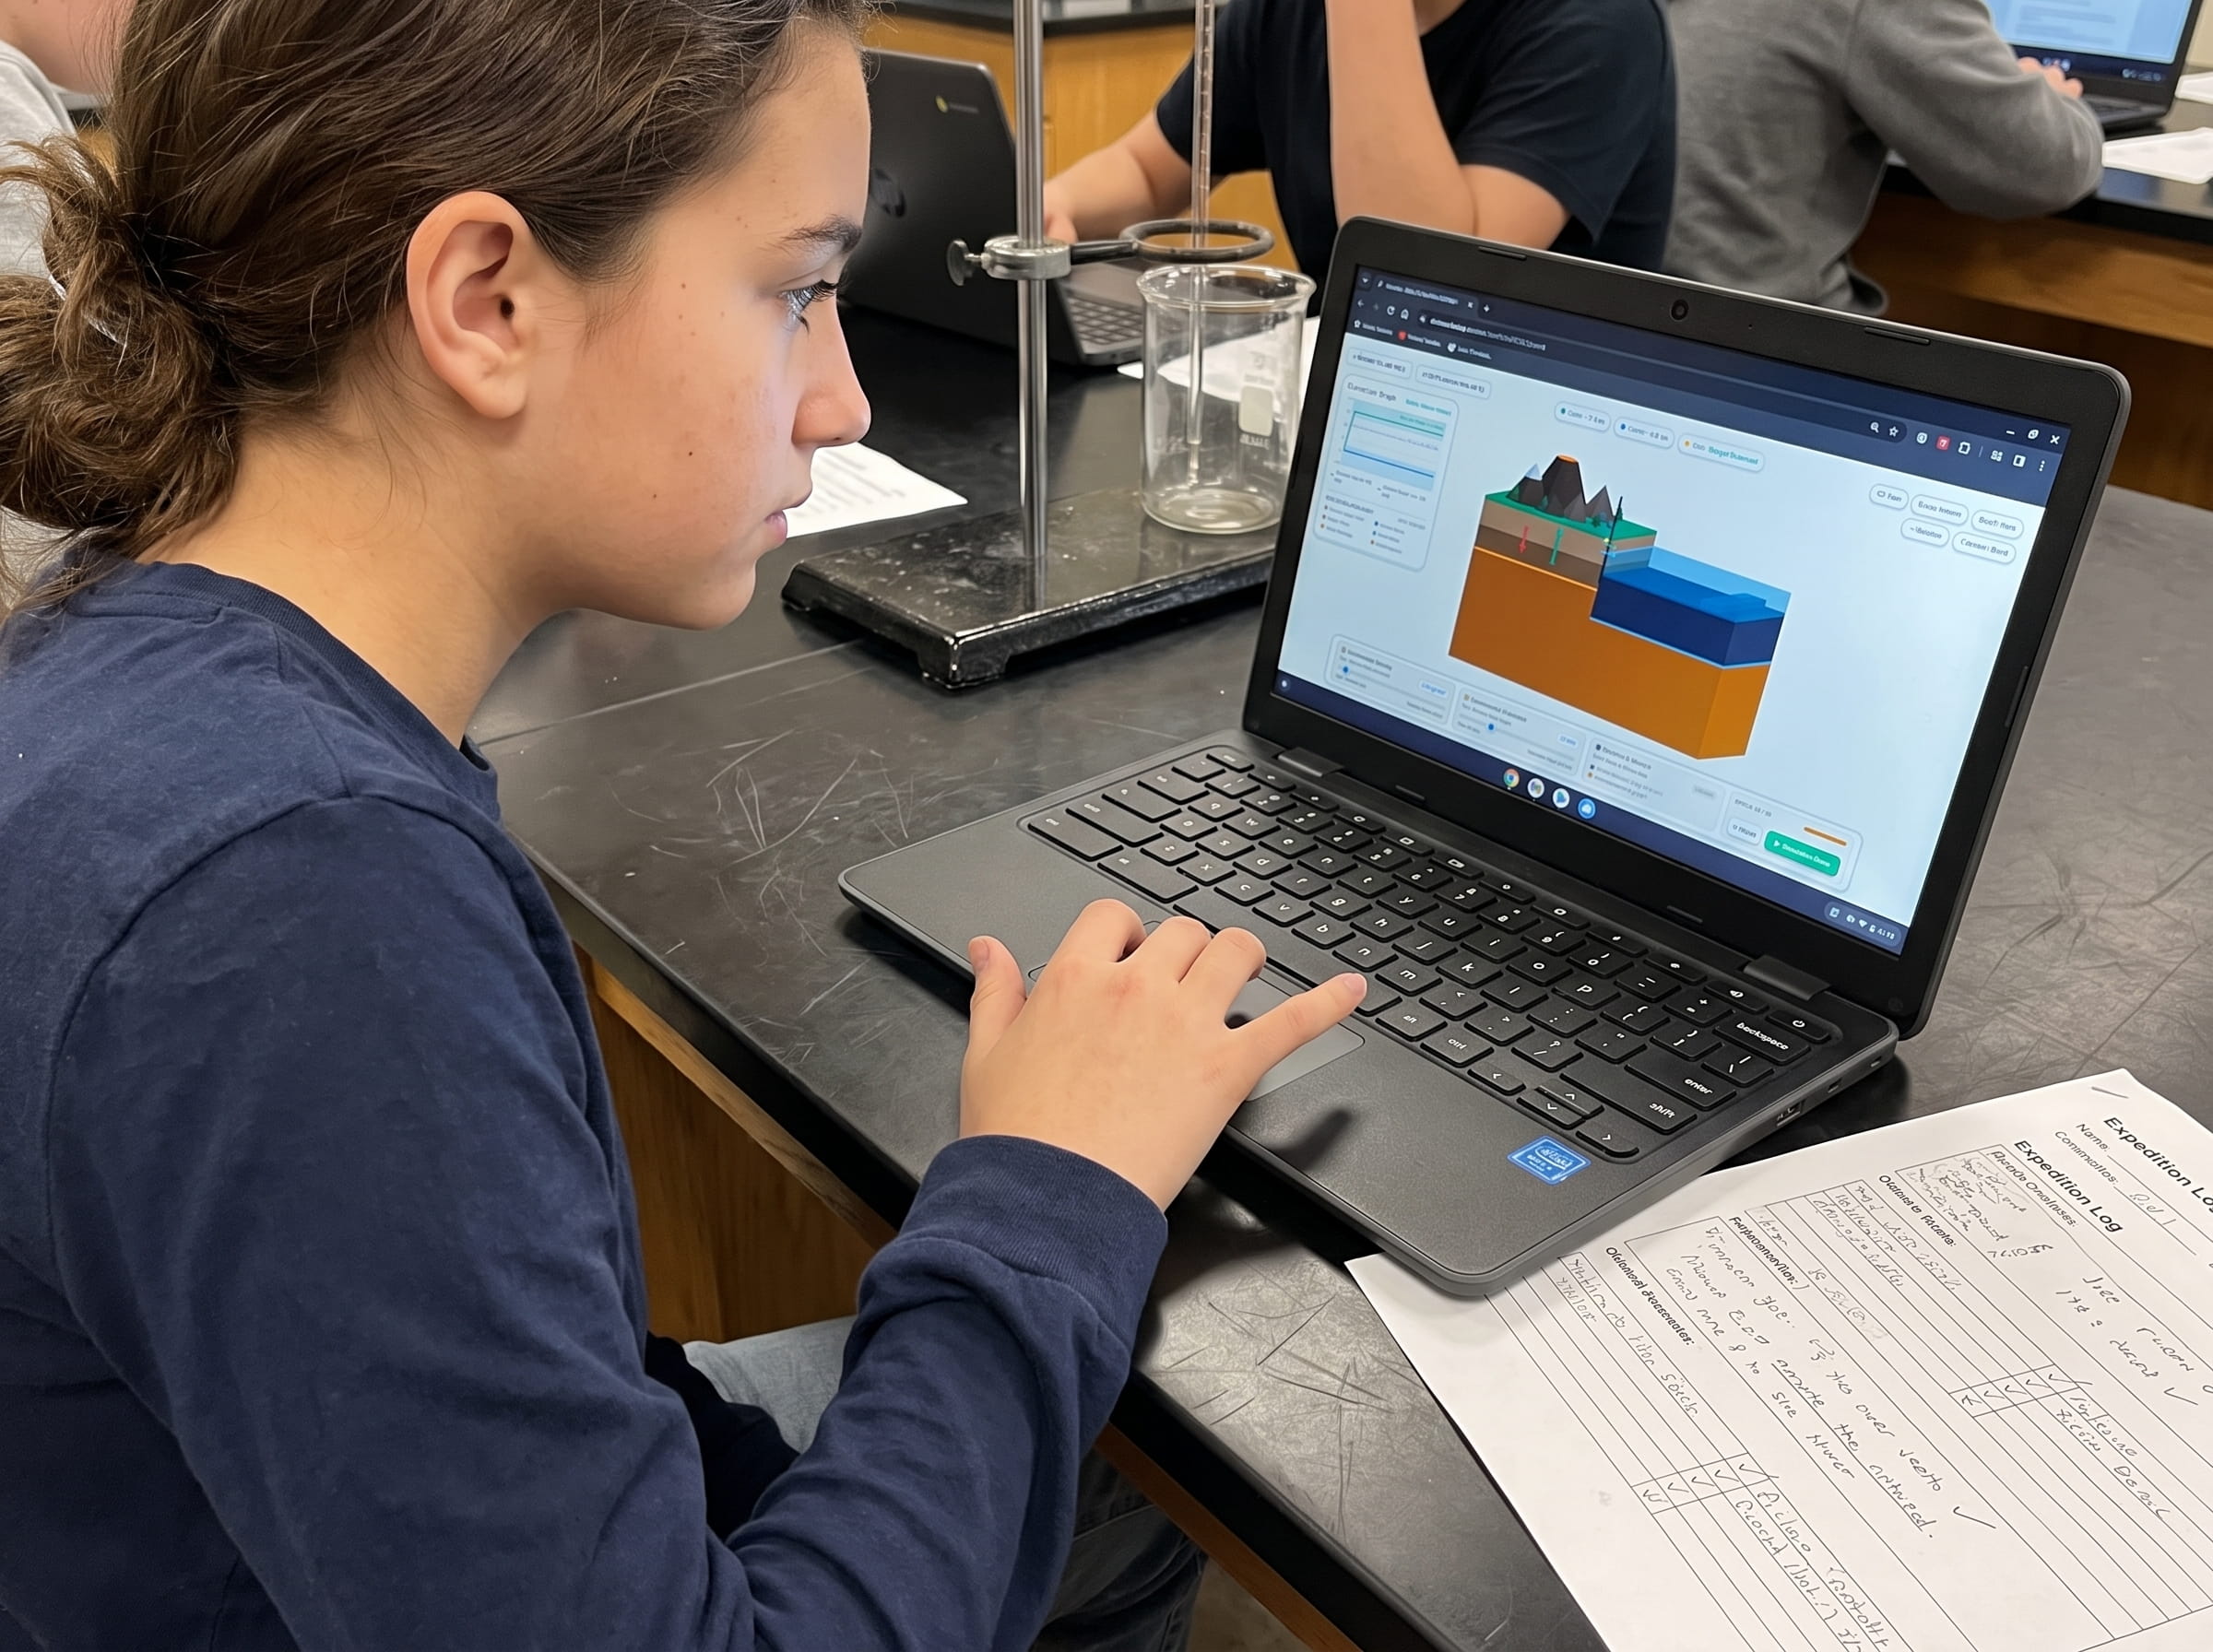
When teaching NGSS MS-ESS2-2 (Geoscience Processes) and MS-ESS3-2 (Natural Hazards), having students observe wave height amplification and speed calculations transforms abstract wave formulas into life-saving scientific intuition. In Volcano Island Level 13, I designed interactive parameter sliders where students can manipulate subduction variables and observe wave mechanics in real-time 3D:
Simulate Seafloor Displacement and Measure Initial Water Mound
Launch Volcano Island Level 13 and adjust the subduction fault lock slider to 100%. Trigger a magnitude 9.0 rupture. Measure the vertical uplift of the seafloor (in meters) and record the initial height and diameter of the displaced water column.
Calculate Deep-Water Wave Velocity Across Ocean Bathymetry
Have students measure water depth along different transects of the simulated ocean basin. Using the shallow-water wave equation v = √(g · d), calculate wave speed in deep oceanic trenches (6,000m), abyssal plains (4,000m), and continental shelves (100m).
Model Coastal Shoaling and Wave Amplitude Amplification
Observe the tsunami wave fronts as they transition from deep water to shallow coastal bays. Monitor the live wavelength and wave height graphs. Record how wavelength compression directly amplifies wave crest height before coastal impact.
Analyze Shoreline Drawback and Evacuation Time Windows
Simulate a scenario where the leading wave edge is a trough rather than a crest. Observe how water drains rapidly away from the shoreline, exposing the seabed minutes before the main crest arrives, and calculate the critical evacuation window.
Frequently Asked Questions About Megathrust Tsunamis
Explore common educator and student questions regarding tsunami wave mechanics, oceanic propagation, and coastal survival:
Why do wind-driven waves never cause tsunamis?
Why don't ships sailing in the deep ocean notice a tsunami passing beneath them?
What causes the ocean to dramatically pull back from beaches before a tsunami strikes?
Can strike-slip earthquakes like California's San Andreas Fault cause major tsunamis?
Related Earth Science Guides and Interactive Laboratories
Continue expanding your middle school earth science and plate tectonics curriculum with our companion interactive guides:
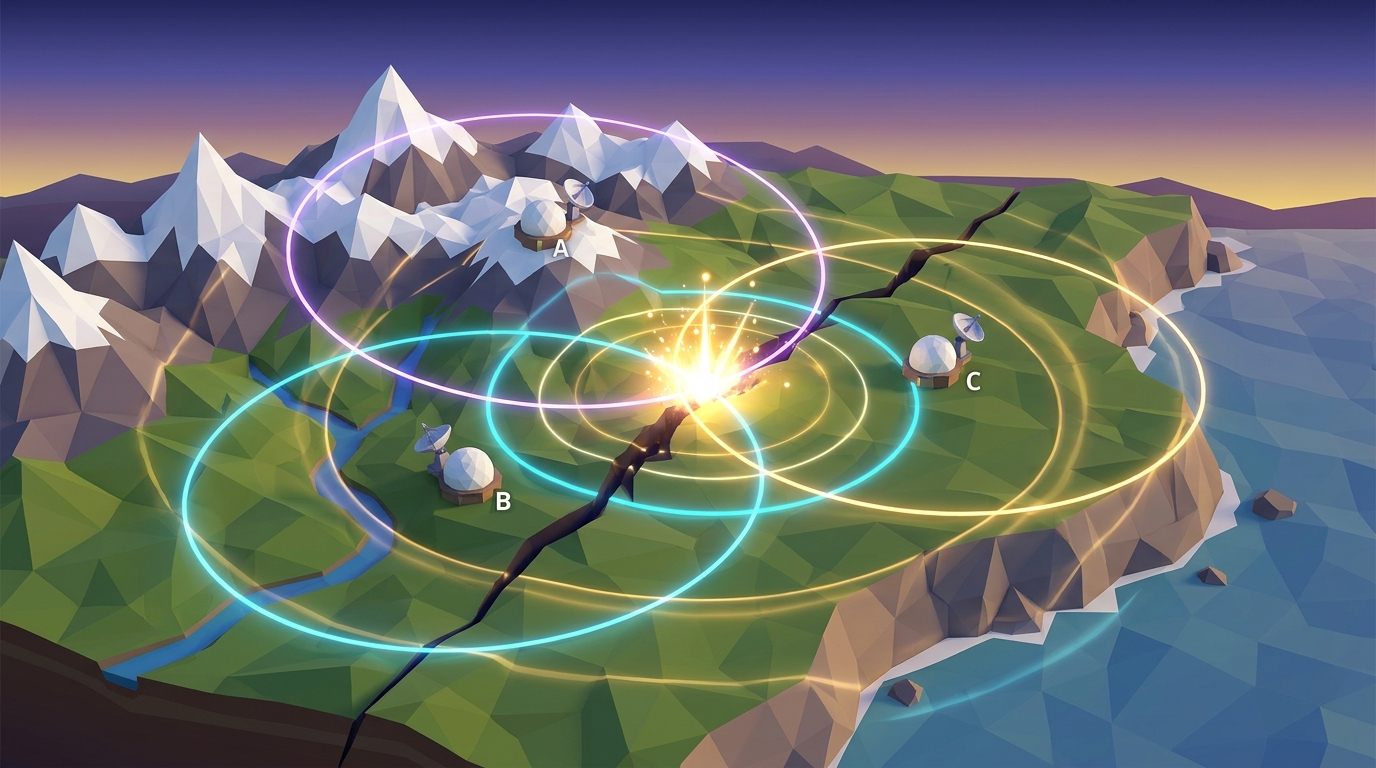
Learn how geologists pinpoint earthquake ruptures in our earthquake epicenter triangulation guide.
Explore how subduction trenches plunge into the mantle in our ocean trenches and subduction zones guide.
Understand explosive roof collapse in our caldera formation guide.
Investigate horizontal shear stress in our transform fault boundaries guide.
Explore magma viscosity in our magma silica viscosity guide.
Explore our complete 20-level hands-on Earth science simulation curriculum options.
Download the Free 24-Page Field Geologist Logbook
Equip your middle school earth science students with printable tsunami wave velocity worksheets, coastal shoaling calculation grids, and NGSS MS-ESS3-2 natural hazards lab pages.