Finding the Secret Rupture: How Do We Know Where the Earth Broke?
When an earthquake strikes, the ground beneath your feet can shudder violently for tens of seconds. Glass rattles, walls creak, and books tumble from shelves. Yet by looking out your window, you cannot tell whether the fault ruptured ten miles away or three hundred miles away, nor can you tell in which compass direction the rupture occurred.
Within minutes of the shaking, seismological agencies like the United States Geological Survey (USGS) publish maps pinpointing the exact latitude, longitude, and depth of the earthquake rupture down to a fraction of a mile. How can scientists sitting in an office hundreds of miles away locate a hidden subterranean fault break using nothing more than squiggly lines recorded on seismographs?
To help middle school students understand this breakthrough, I use the analogy of thunder and lightning: during a severe summer storm, lightning flashes through the sky almost instantaneously because light travels at 300,000 kilometers per second. Thunder, however, travels through the air at the relatively slow speed of sound (approximately 343 meters per second). If you count the seconds between the flash and the boom, you can calculate your distance from the strike: five seconds equals roughly one mile. The longer the delay, the farther away the lightning struck. In seismology, fast P-waves are the lightning, slower S-waves are the thunder, and the time delay between them reveals the exact distance to the earthquake.
The Physics of Seismic Waves: P-Waves, S-Waves, and Surface Waves
When rocks along a locked fault suddenly fracture under tectonic stress, accumulated elastic strain energy is detonated as seismic waves that travel outward in expanding concentric spheres through Earth's interior. These body waves divide into two distinct physical categories:
1. Primary Waves (P-Waves): P-waves are compressional or longitudinal waves. They push and pull rock particles in the exact same direction that the wave is traveling, just like compression coils moving through a stretched slinky. P-waves are the fastest seismic waves on Earth, traveling through crustal rock at speeds between 5 and 7 kilometers per second (over 13,000 miles per hour). Because they compress rock volumes, P-waves can travel through all states of matter: solid rock, liquid magma, water oceans, and the gaseous atmosphere.
2. Secondary Waves (S-Waves): S-waves are shear or transverse waves. They displace rock particles side-to-side and up-and-down, perpendicular to the direction the wave is propagating, like shaking a heavy jump rope. S-waves are significantly slower than P-waves, traveling through crustal rock at approximately 3 to 4 kilometers per second (roughly 60% of P-wave speed). Crucially, liquids and gases have zero shear resistance: you cannot shear water. Therefore, S-waves cannot travel through liquids, an empirical physical fact that allowed British geologist Richard Oldham in 1906 to discover that Earth possesses a liquid outer core.
3. Surface Waves (Rayleigh and Love Waves): When P and S waves reach the surface of the Earth, their interaction creates surface waves. Although surface waves travel slower than body waves, they produce the largest rolling ground displacements and are responsible for nearly all architectural damage during an earthquake.
The Geometry of Triangulation: Why One or Two Stations Aren't Enough
Because P-waves travel faster than S-waves, the gap between their arrival times grows wider the further the waves travel. A seismograph located right next to the epicenter records the P-wave and S-wave almost simultaneously. A seismograph 500 kilometers away records a wide gap of over 45 seconds between the two waves.
By measuring this S-P time lag on a seismogram and referencing a standardized seismic travel-time curve, a geophysicist can calculate the precise distance from the station to the earthquake. However, distance alone does not reveal location. Here is why geometric triangulation requires three distinct stations:
One Station: Knowing that an earthquake occurred 300 kilometers from your station tells you distance, but gives you zero information about direction. The epicenter could be 300 km north, south, east, or west. Drawing this on a map creates a circle with a 300-kilometer radius: the epicenter could be anywhere along that 360-degree perimeter.
Two Stations: If a second station located 400 kilometers away calculates an epicentral distance of 250 kilometers, you draw a second circle. Two intersecting circles cross at exactly two distinct points. You have narrowed the possibilities down to two locations, but you still cannot determine which of the two points represents the true fault rupture.
Three Stations: When a third station calculates its distance and draws a third circle, all three circles intersect at exactly ONE unique coordinate on the map. This triple intersection point pinpoints the earthquake epicenter with remarkable geographic precision.
Comparative Analysis: Three-Station Seismograph Triangulation Scenario
The data table below demonstrates how three regional seismic monitoring stations recorded a real-world magnitude 6.4 earthquake along the western North American plate boundary:
| Seismic Station | Station Coordinates | P-Wave Arrival (UTC) | S-Wave Arrival (UTC) | S-P Lag Time (Seconds) | Calculated Distance (km) |
|---|---|---|---|---|---|
| Closest Monitoring StationStation Alpha (Eureka, CA) | 40.80° N, 124.16° W | 14:02:15.0 | 14:02:50.0 | 35.0 seconds | 280 km (174 miles) |
| Station Beta (Reno, NV) | 39.52° N, 119.81° W | 14:02:30.4 | 14:03:18.4 | 48.0 seconds | 390 km (242 miles) |
| Station Gamma (Boise, ID) | 43.61° N, 116.20° W | 14:03:02.1 | 14:04:17.1 | 75.0 seconds | 610 km (379 miles) |
| Triangulated Epicenter | Cape Mendocino Triple Junction (40.35° N, 124.62° W) | 14:01:32.0 (Rupture Time) | Hypocenter Depth: 14 km | Uncertainty Ellipse: ± 2.1 km | San Andreas / Mendocino Fault Frontier |
Triangulate Earthquake Epicenters in Interactive 3D
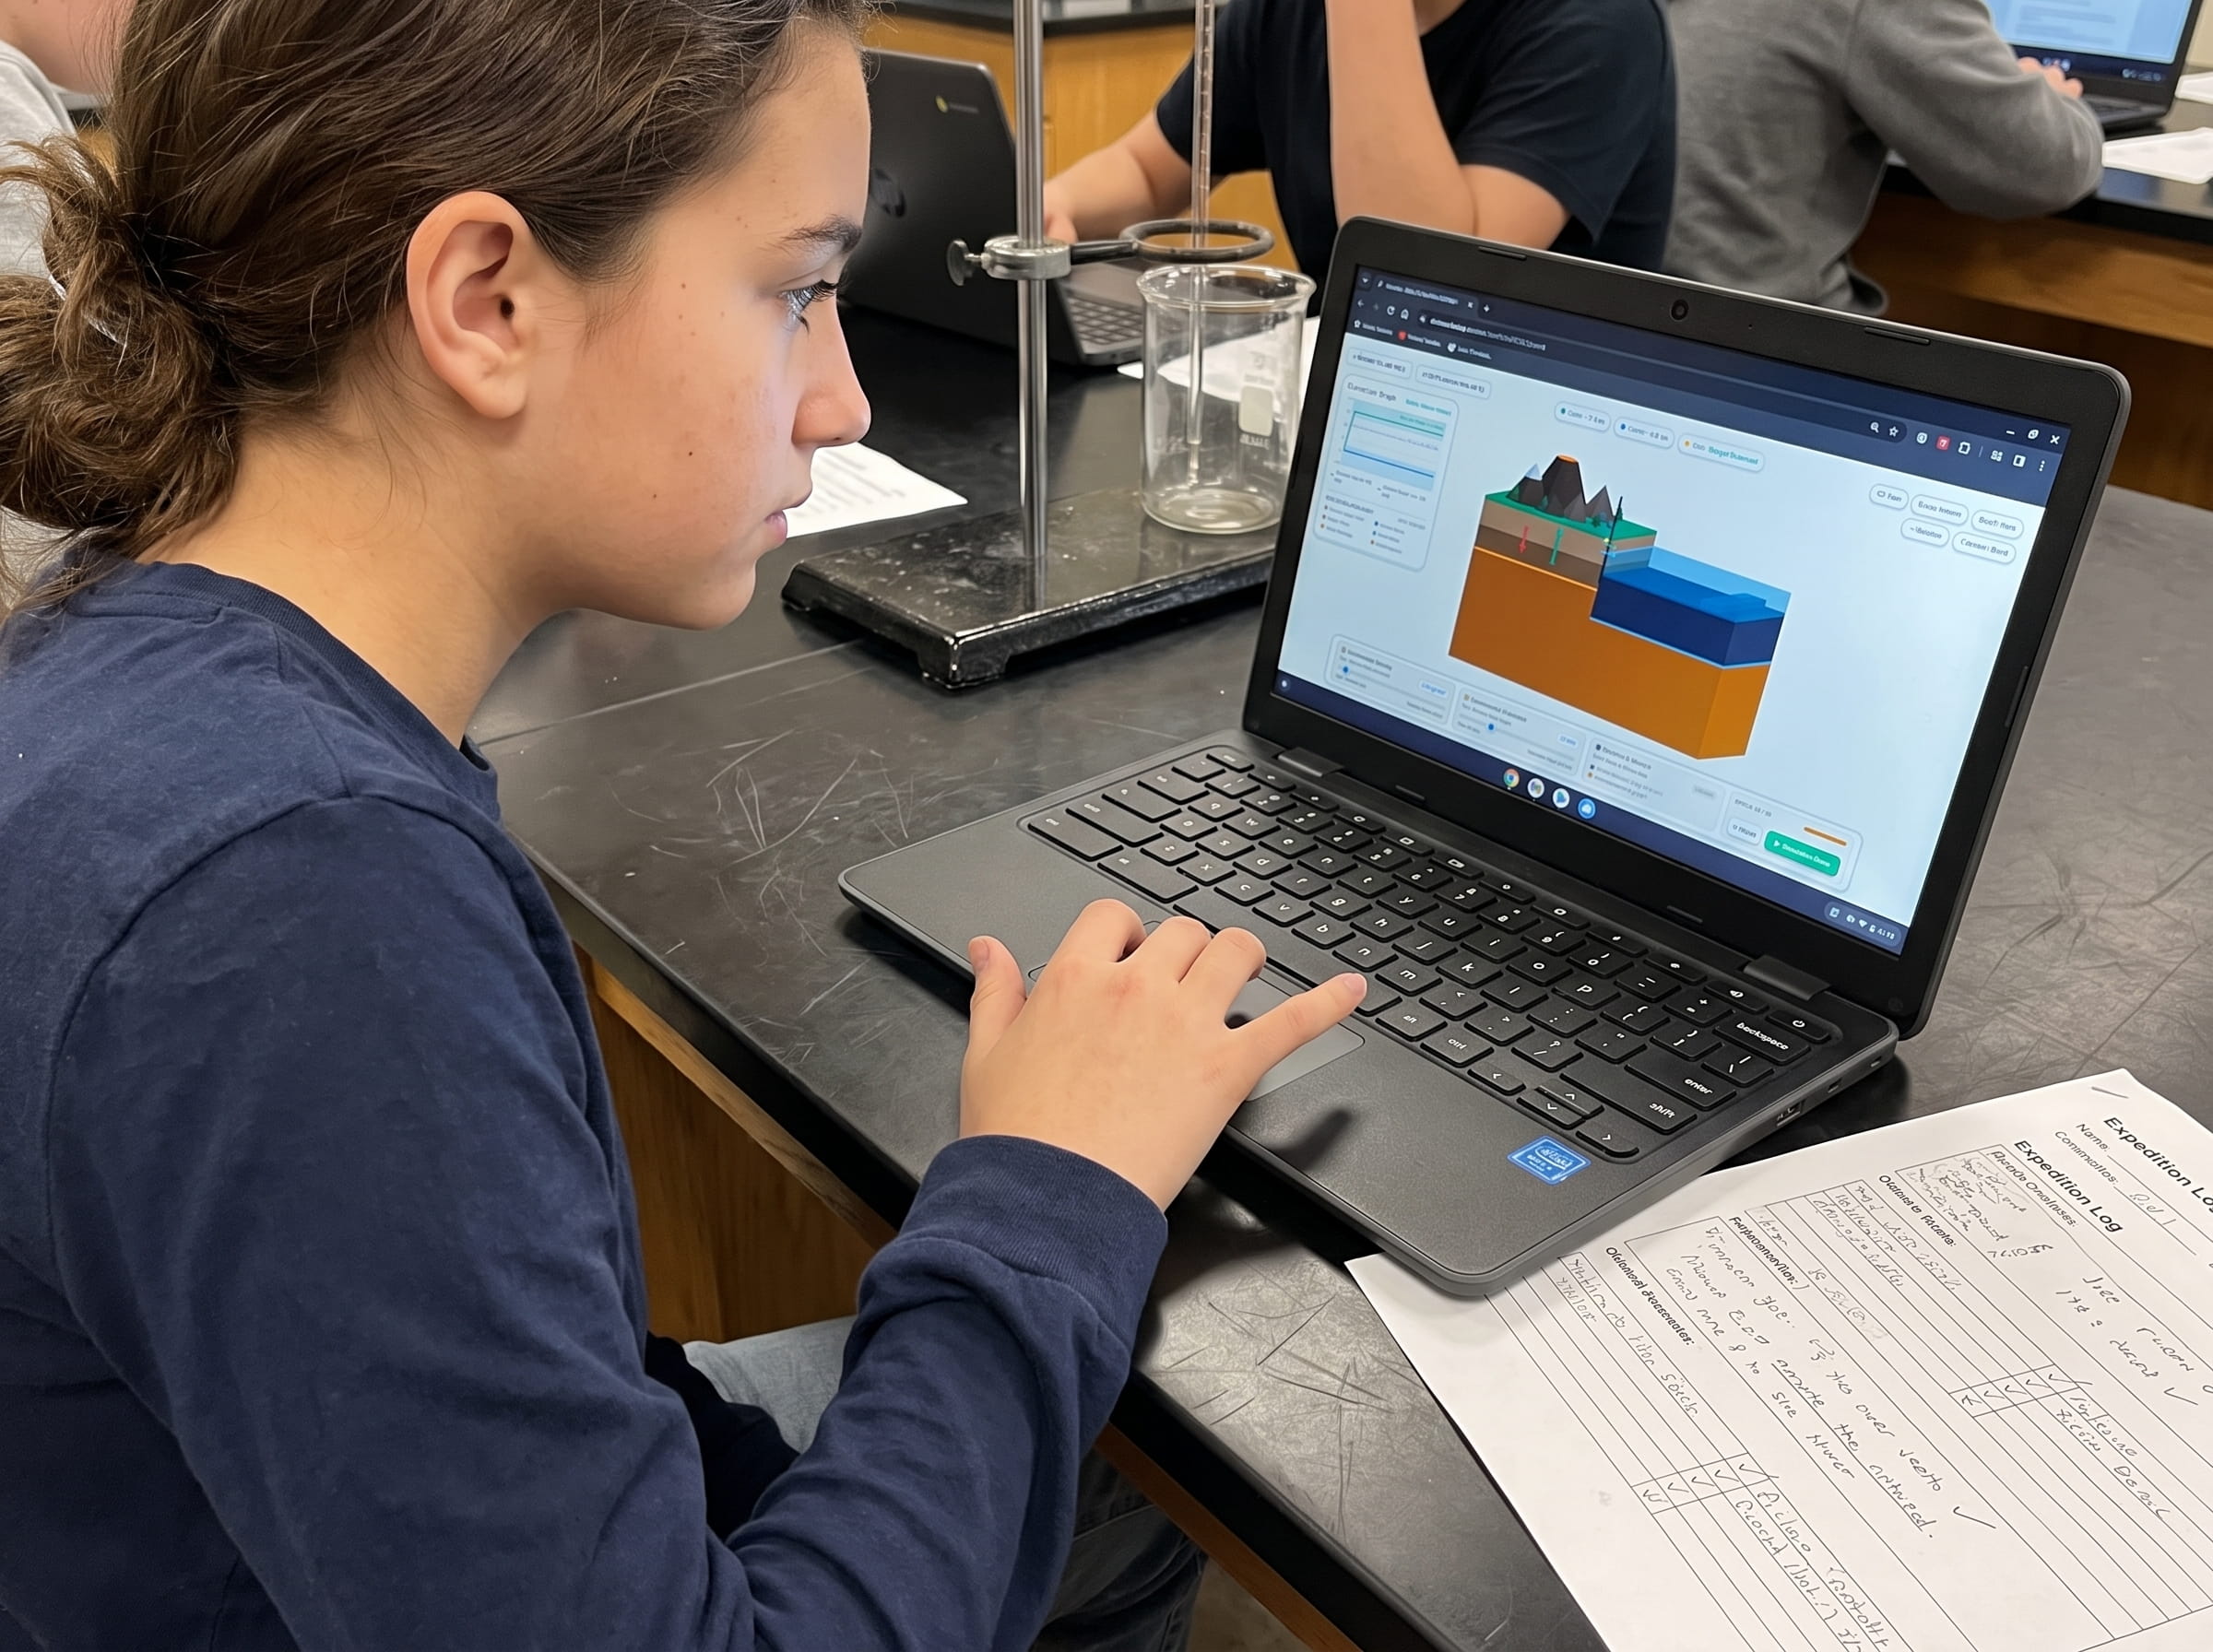
Trigger subterranean fault ruptures across a live tectonic map. Read simulated digital seismograms, calculate S-P wave intervals, draw expanding distance radii from three seismic stations, and pinpoint the fault epicenter in real-time 3D.
Teaching this topic tomorrow? Download the Free NGSS Student Lab Sheet (Printable PDF)
Equip your middle school earth science students with printable three-station triangulation maps, S-P travel-time reference graphs, and NGSS MS-ESS2-2 inquiry lab worksheets.
Hands-On Classroom Inquiry: 4-Step Compass Triangulation Protocol
When teaching NGSS MS-ESS2-2 (Geoscience Processes & Plate Motions), students frequently struggle with the manual compass geometry required to locate an epicenter. In Volcano Island Level 12, I designed an interactive digital seismograph simulator where students can test and verify triangulation principles in real time:
Read Raw Seismograms and Calculate the S-P Interval
Provide students with three simulated seismograms from three different cities. Have them identify the sudden high-frequency onset of the P-wave, followed by the larger-amplitude S-wave arrival. Subtract the P-wave timestamp from the S-wave timestamp to find the exact S-P interval in seconds.
Convert S-P Lag Time to Epicentral Distance
Using a standardized seismic travel-time curve graph, have students align their calculated S-P interval on the vertical time axis and project downward to read the epicentral distance in kilometers along the horizontal axis.
Draw Scaled Distance Radii on a Regional Map
Set a drawing compass to the scaled distance for Station 1 and draw a circle around its city marker. Repeat the process for Station 2 and observe the two intersection points. Finally, draw the circle for Station 3 to isolate the unique epicenter coordinate.
Correlate Epicenter Coordinates with Known Fault Lines
Cross-reference your triangulated epicenter coordinates with an active tectonic plate boundary map. Identify the specific strike-slip, subduction, or rift fault system that produced the rupture.
Frequently Asked Questions About Earthquake Triangulation
Explore common educator and student questions regarding seismic waves, epicenter accuracy, and early warning systems:
What is the difference between an earthquake focus and an epicenter?
Why do three circles drawn on paper sometimes form a small triangle instead of a single perfect point?
How do modern computer networks locate earthquakes in seconds without compasses?
How does the difference between P and S wave speeds enable Earthquake Early Warning (EEW) systems?
Related Earth Science Guides and Interactive Laboratories
Continue expanding your middle school earth science and plate tectonics curriculum with our companion interactive guides:
Explore strike-slip fault mechanics in our transform fault boundaries guide.
Learn how tectonic plates collide and subduct in our convergent plate boundaries subduction guide.
Discover Earth's deepest chasms in our ocean trenches and subduction zones guide.
See how supervolcanoes collapse in our caldera formation guide.
Explore magma viscosity and eruption types in our magma silica viscosity guide.
Explore our complete 20-level hands-on Earth science simulation curriculum options.
Download the Free 24-Page Field Geologist Logbook
Equip your middle school earth science students with printable three-station triangulation maps, S-P travel-time reference graphs, and NGSS MS-ESS2-2 inquiry lab worksheets.