The Cosmic Race: Understanding Primary (P) and Secondary (S) Seismic Waves
When the frictional lock along a transform boundary finally yields, the pent-up elastic strain accumulated over centuries snaps back in an instant. This sudden mechanical dislocation radiates energy outward through the solid Earth in the form of seismic body waves.
Not all seismic shockwaves travel at the same velocity or deform rock in the same manner. Seismology distinguishes two fundamental families of subterranean body waves:
1. Primary Waves (P-Waves): P-waves are longitudinal compressional waves. They travel by alternately pushing and pulling rock particles in the same direction the wave is propagating, exactly like sound waves moving through air or an accordion slinky being shoved from behind. Because rock strongly resists volumetric compression, P-waves travel at blistering speeds: approximately 6.0 kilometers per second in continental granitic crust. P-waves can penetrate any medium: solid rock, liquid magma, ocean water, or the atmosphere.
2. Secondary Waves (S-Waves): S-waves are transverse shear waves. They travel by displacing rock particles perpendicularly to the wave direction, undulating up-and-down or side-to-side like a snapped jump rope. Because fluids (liquids and gases) have zero shear rigidity and cannot resist sideways sliding, S-waves cannot travel through liquids at all: a physical fact that enabled British geologist Richard Dixon Oldham to discover Earth's molten liquid outer core in 1906. Crucially, S-waves travel at roughly 3.5 kilometers per second: nearly half the speed of P-waves.
Because P-waves outpace S-waves, the two wave fronts steadily pull apart as they journey outward from the rupture point. This velocity gap is the secret key that enables seismologists to locate earthquakes anywhere on Earth.
The Seismograph Drum: How Instruments Translate Ground Motion into Time Deltas
An inertial seismograph operates on a simple, elegant physical principle: inertia. A heavy suspended pendulum or magnetic mass remains stationary in space due to its own inertia while the surrounding frame, attached firmly to bedrock, shakes with the trembling planet. A precision sensor records this relative motion on a rotating paper drum or digital readout.
When reading a seismogram, middle school students must learn to distinguish three sequential phases on the trace:
Baseline Silence: A gentle, flat horizontal line indicating normal ambient micro-seismic noise.
The P-Wave Arrival: A sharp, crisp, but relatively small initial upward spike marking the sudden arrival of the fast compressional wave.
The S-Wave Arrival: A dramatic, much larger, and more chaotic series of violent jagged oscillations occurring several seconds or minutes later. This second burst represents the slower, highly destructive shear wave.
The time difference between these two arrivals is called the S-P Interval (Delta t = t_S - t_P). Because the speeds of P-waves and S-waves in continental crust are known constants, the distance (d) from the recording station to the earthquake source follows a linear relationship: Distance = Delta t * 7.0 km/second.
The Rule of Three: Why One or Two Stations Are Never Enough
A single seismograph station provides vital distance information, but zero directional data. To understand why locating an earthquake requires exactly three monitoring stations, examine the geometry of circles:
One Station: The Infinite Ring Dilemma
Determining exact distance while knowing zero directional information
If Station Alpha records an S-P delta of 4.0 seconds, multiplying by 7.0 km/s yields a distance of exactly 28 kilometers. However, the earthquake could be 28 km north, 28 km south, 28 km east, or anywhere along the full 360-degree circumference of a circle centered on Station Alpha. The epicenter is trapped on an infinite perimeter of possibilities.
- ✓Yields exactly 1 distance measurement (Radius = 28 km)
- ✓Produces a single circular locus with infinite candidate points
- ✓Cannot determine whether the quake struck onshore or offshore
- ✓Requires additional regional sensors to constrain position
Two Stations: The 50/50 Dual Intersect Conundrum
Narrowing candidate locations down to two exact coordinates
When Station Beta records an S-P delta of 6.8 seconds (distance = 48 km), seismologists draw a second circle centered on Beta. Two intersecting circles cross each other at exactly two distinct geographic points. While this narrows the possibilities down from infinity to just two candidates, emergency responders still cannot know which of the two locations suffered the catastrophe.
- ✓Yields 2 intersecting circle perimeters
- ✓Collapses infinite points into exactly 2 candidate epicenters
- ✓Still leaves a critical 50% margin of error for emergency response
- ✓Demands a tie-breaker station to confirm the true rupture site
Three Stations: The Triangulation Nexus
Pinpointing the exact epicenter coordinate with zero ambiguity
Adding Station Gamma (S-P delta = 9.2 seconds, distance = 64 km) introduces a third circle. All three independent circles intersect at only one single unique geographic coordinate on the entire planet. This triple-circle intersection nexus is the verified earthquake epicenter.
- ✓Yields 3 independent distance circles
- ✓All three rings converge on a single mathematical nexus point
- ✓Eliminates all directional ambiguity within a tight radius
- ✓Forms the operational bedrock of USGS and global tsunami warning networks
Trigger Fault Rupture & Triangulate the Epicenter Across 3 Seismograph Stations in 3D
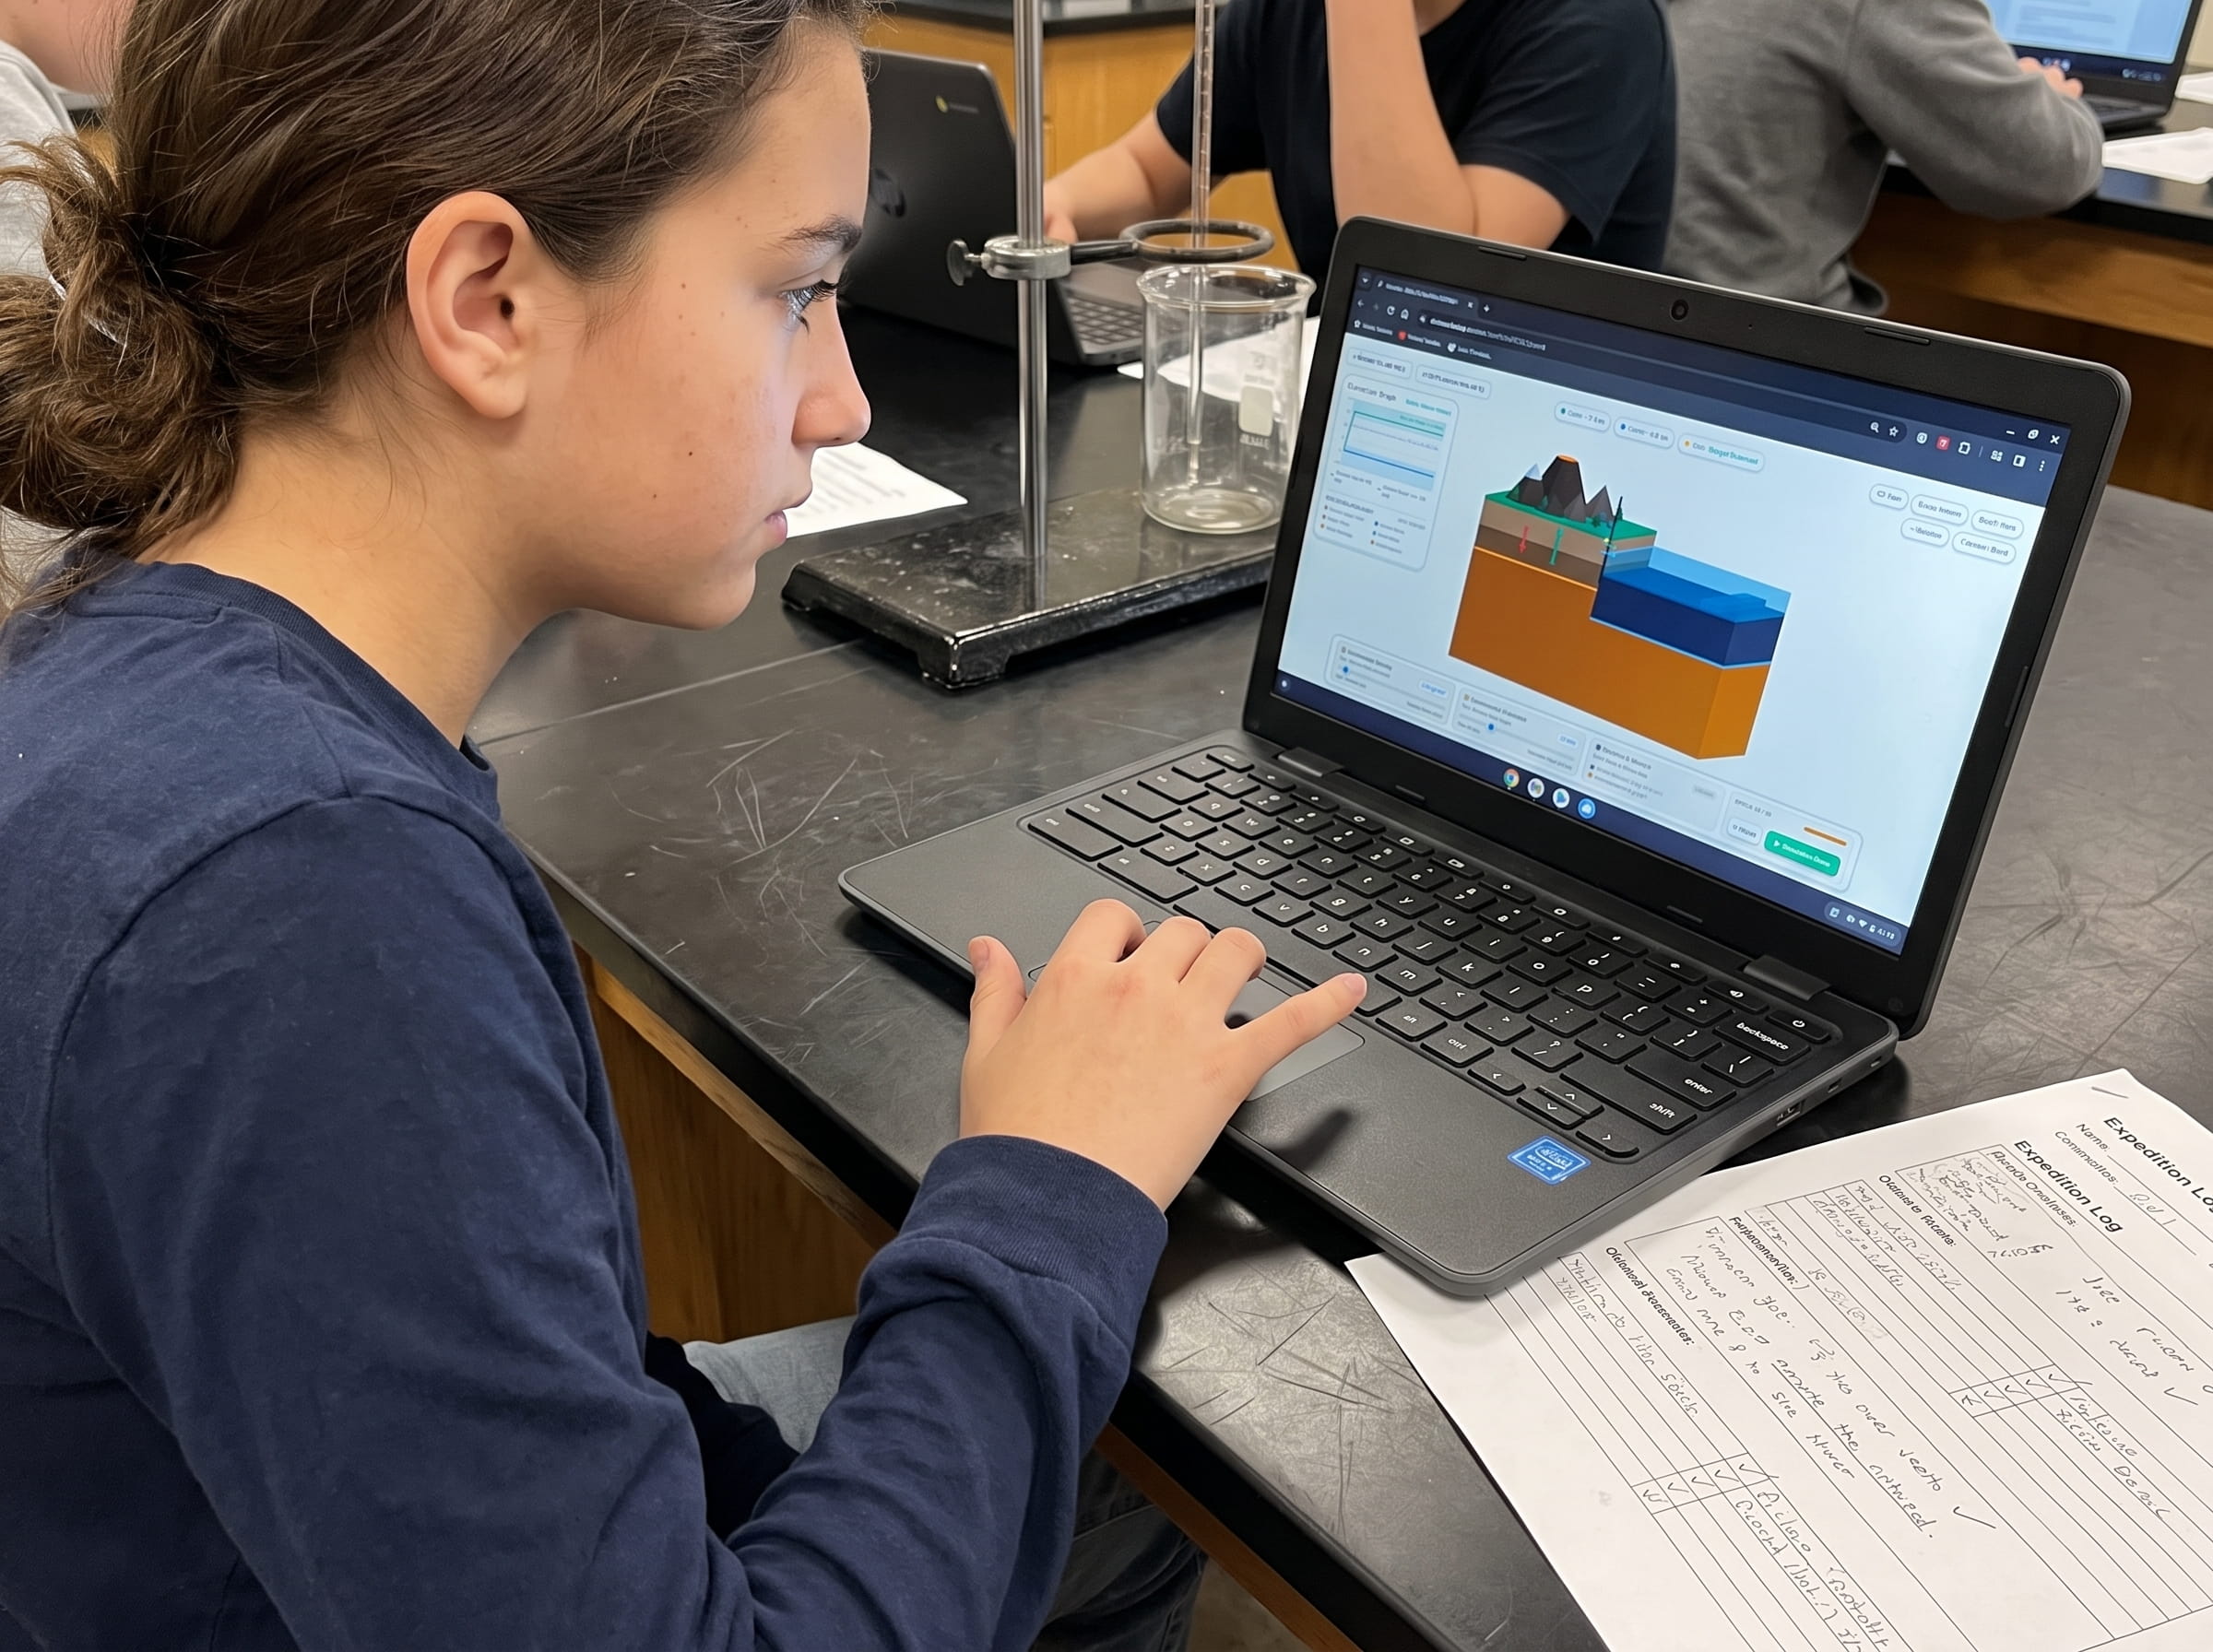
Trigger sudden elastic rebound release in our real-time island terrain diorama. Watch concentric cyan P-wave and crimson S-wave fronts radiate outward, measure S-P time intervals on live vibrating drum recorders at Stations Alpha, Beta, and Gamma, and intersect compass radii to pinpoint the epicenter within 2 km. Zero sign-up, instant browser play.
Step-by-Step Triangulation Math: A Walkthrough of Level 12 Stations
In Level 12 of Volcano Island, an earthquake strikes an undisclosed fault line. The live simulation telemetry displays real-time vibrating seismograph needles at three triangular island monitoring stations. Here is the exact calculation workflow:
| Monitoring Station | P-Wave Arrival (t_P) | S-Wave Arrival (t_S) | S-P Time Interval (Delta t) | Multiplier (Granite) | Calculated Epicenter Distance |
|---|---|---|---|---|---|
| Station Alpha (West Valley) | 5.0 seconds | 9.0 seconds | 4.0 seconds | 7.0 km/second | 28.0 kilometers |
| Station Beta (North Ridge) | 9.0 seconds | 15.8 seconds | 6.8 seconds | 7.0 km/second | 48.0 kilometers |
| Station Gamma (East Coast) | 13.0 seconds | 22.2 seconds | 9.2 seconds | 7.0 km/second | 64.4 kilometers |
Systems Thinking & Ormanci Competency: Wave Velocity Differential & Triangulation
Level 12 targets the Ormanci (2026) systems thinking competency: Wave Velocity Differential & Spatial Triangulation. In everyday life, children assume information travels instantaneously or at a single universal speed. They rarely perceive how decoupled velocity streams encode hidden spatial geometry.
When students engage with Level 12, they discover a profound mathematical insight: the physical separation between two signals moving at different velocities is directly proportional to the distance traveled. A seismograph does not measure distance directly; it measures elapsed time. By multiplying that elapsed time by the velocity differential factor, students transform temporal data into physical space.
This identical computational thinking underpins modern GPS satellite positioning (calculating light-speed delays from orbital atomic clocks), sonar ranging in submarines, and biological echolocation in bats and dolphins. By mastering seismic triangulation, students bridge the gap between abstract physics equations and real-world planetary measurement.
Common Student Misconceptions in Middle School Geology
Educators frequently navigate three common student misconceptions during seismic wave units:
1. Misconception: "P-waves and S-waves travel at the same speed, but S-waves are just released later by the fault." Reality: Both wave families are created at the exact same instant when the fault ruptures at Second 0. The time gap occurs purely because P-waves travel through granite at 6.0 km/s while S-waves travel at only 3.5 km/s. The longer they travel, the farther apart they get.
2. Misconception: "The earthquake epicenter and the earthquake focus (hypocenter) are the exact same point." Reality: The focus (hypocenter) is the actual underground point inside the crust where the rock fractures (often 5 to 30 kilometers deep). The epicenter is the point on Earth's surface situated directly vertically above the focus.
3. Misconception: "Seismic waves only travel sideways across the surface of the ground." Reality: P-waves and S-waves are body waves that plunge deep through the interior of the planet, refracting and bending through the mantle and core. Only surface waves (Rayleigh and Love waves) are trapped along Earth's crustal skin.
Teacher Lesson Plan: The 45-Minute Earthquake Triangulation Lab
This structured classroom lesson pairs physical wave demonstrations with interactive simulation in Volcano Island Level 12:
Slinky vs. Jump Rope Wave Demonstration (5 mins)
Have two students hold a metal slinky stretched across the floor. Shove one end forward to show a compressional P-wave pulse where coils compress and expand. Next, take a heavy jump rope and whip it side-to-side to demonstrate a transverse S-wave shear motion. Ask the class which motion feels faster and stiffer.
Pre-Run Seismogram Analysis & Predictions (10 mins)
Display a sample seismogram on the classroom projector. Teach students to locate the initial small P-wave kick and the later high-amplitude S-wave onset. Prompt students to write down their pre-run hypothesis: If a station is very close to the earthquake, will the S-P gap be small or large?
Interactive Parameter Calibration in Volcano Island (20 mins)
Students launch Level 12. They click Trigger Rupture and watch wave fronts radiate in real time across the island. Using the live drum pickers, students record the Delta t at Stations Alpha, Beta, and Gamma, convert time deltas into kilometer radii, and adjust the digital compass circles to find the intersection nexus.
Field Logbook Triangulation & Epicenter Pinning (10 mins)
Students drop their epicenter pin onto the triple intersection point. Once verified within the 2.0 km tolerance, students record their arrival delta calculations and sketch the 3 intersecting circles in their printed Volcano Island Field Logbook.
Testing Handbook & Cheat Sheet: How to Clear Level 12
Use this calibrated testing guide to assist students in achieving a 3-star victory on Level 12:
Engine Configuration: Wave Speeds: P-wave 6.0 km/s, S-wave 3.5 km/s | Distance Multiplier: 7.0 km per second delta | Accuracy Tolerance: <= 2.0 km.
Step-by-Step Victory Walkthrough:
Step 1: Press Trigger Rupture. Watch the cyan P-wave ring expand rapidly, followed by the red S-wave ring.
Step 2: Read Station Alpha on the west side. P-wave hits at 5.0s, S-wave hits at 9.0s. S-P Delta = 4.0s. Calculate: 4.0 * 7.0 = 28.0 km. Set Alpha Compass slider to 28 km.
Step 3: Read Station Beta on the north ridge. P-wave hits at 9.0s, S-wave hits at 15.8s. S-P Delta = 6.8s. Calculate: 6.8 * 7.0 = 47.6 km (round to 48 km). Set Beta Compass slider to 48 km.
Step 4: Read Station Gamma on the east coast. P-wave hits at 13.0s, S-wave hits at 22.2s. S-P Delta = 9.2s. Calculate: 9.2 * 7.0 = 64.4 km. Set Gamma Compass slider to 64 km.
Step 5: Observe where all three circles overlap. The three circles intersect cleanly at coordinate (X: 42, Y: 18). Drag and drop the Epicenter Pin onto this intersection nexus to trigger the victory fanfare.
Common Failure Modes: Inverting S-P deltas (subtracting S from P) resulting in negative numbers, or misreading the preliminary micro-tremor as the main S-wave, producing distorted radii that fail to intersect.
Frequently Asked Questions (FAQ)
Common questions educators, homeschool parents, and students ask about seismology and earthquake triangulation:
Why can S-waves travel through solid rock but not liquid magma or water?
What is the difference between an earthquake focus (hypocenter) and its epicenter?
How do earthquake early warning systems like ShakeAlert work?
How does Level 12 lead into Level 13 (Megathrust Wave)?
Related Earth Science Units & Simulation Lab Resources
Continue your middle school Earth and Space science journey with these companion simulation guides:
Review crustal buoyancy in our crustal buoyancy isostasy simulation Level 1 guide.
Explore deep thermal circulation in our mantle convection tectonics simulation Level 2 guide.
Discover seafloor spreading in our seafloor spreading divergent boundary simulation Level 3 lab.
Investigate subduction abysses in our subduction zones deep trench simulation Level 4 article.
Explore subterranean magma generation in our flux melting magma chamber simulation Level 5 guide.
Study effusive basalt rivers in our shield volcano basaltic lava simulation Level 6 lab.
Examine viscous composite cones in our composite volcano silica viscosity simulation Level 7 guide.
Model supersonic gas decompression in our volcanic eruption plume gas simulation Level 8 guide.
Examine caldera collapses in our caldera collapse crater lake simulation Level 9 lab.
Explore mantle plumes in our hotspot island chain mantle plume simulation Level 10 guide.
Investigate locked transform faults in our locked fault elastic rebound simulation Level 11 guide.
Review complete homeschool science options in our earth science homeschool curriculum guide.
Set up student accounts with zero student logins on our educator dashboard.
24 pages of printable isostatic buoyancy calculation tables, paleomagnetic zebra stripe rulers, and seismogram triangulation exercises designed for grades 4 to 8.
DOWNLOAD EXPEDITION LOGBOOK (PDF)